Fijian vs Albanian Average Family Size
COMPARE
Fijian
Albanian
Average Family Size
Average Family Size Comparison
Fijians
Albanians
3.36
AVERAGE FAMILY SIZE
100.0/ 100
METRIC RATING
52nd/ 347
METRIC RANK
3.17
AVERAGE FAMILY SIZE
1.5/ 100
METRIC RATING
257th/ 347
METRIC RANK
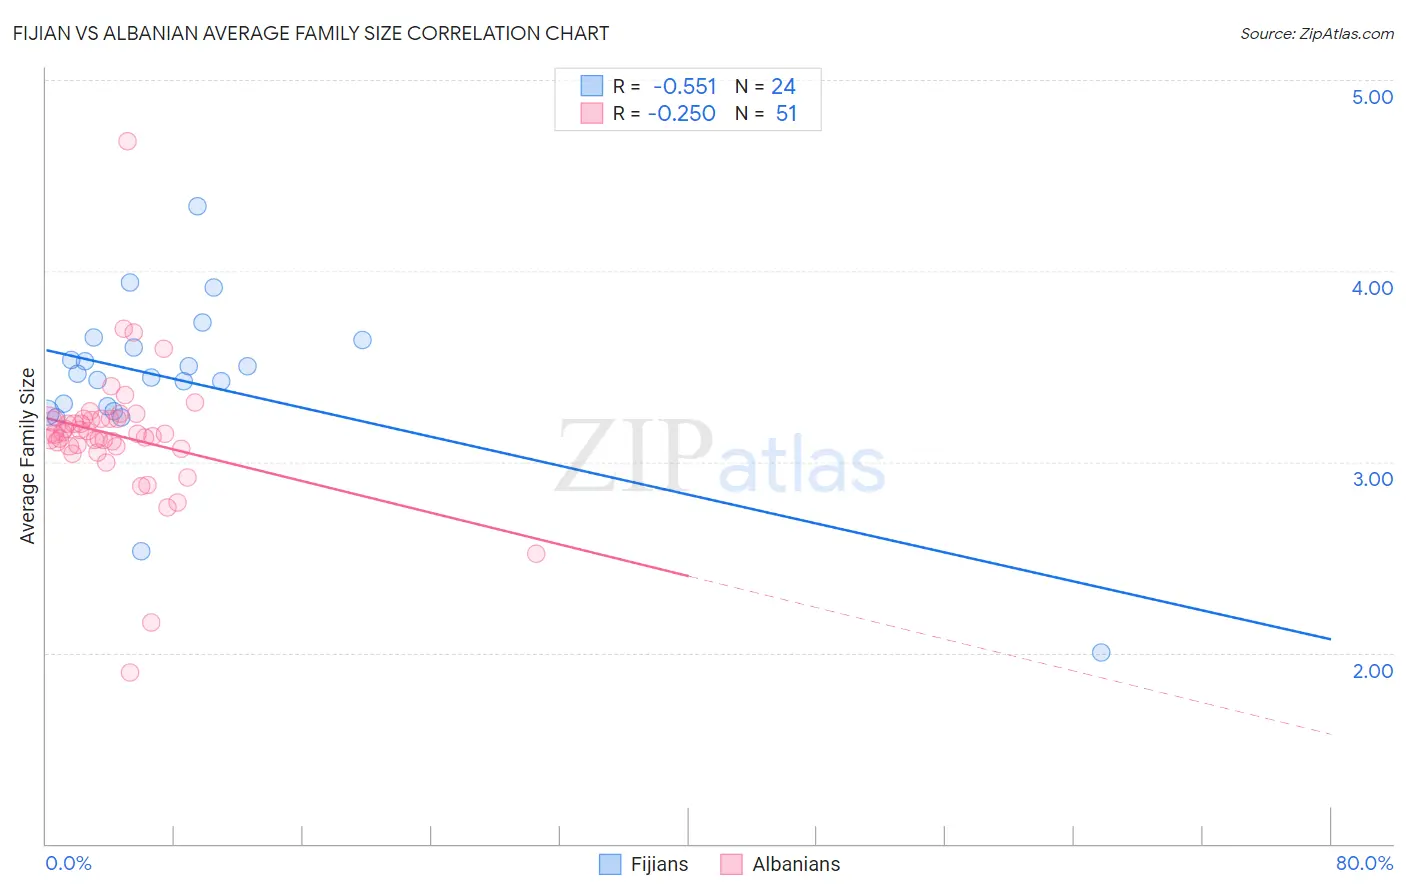
Fijian vs Albanian Average Family Size Correlation Chart
The statistical analysis conducted on geographies consisting of 55,947,966 people shows a substantial negative correlation between the proportion of Fijians and average family size in the United States with a correlation coefficient (R) of -0.551 and weighted average of 3.36. Similarly, the statistical analysis conducted on geographies consisting of 193,186,402 people shows a weak negative correlation between the proportion of Albanians and average family size in the United States with a correlation coefficient (R) of -0.250 and weighted average of 3.17, a difference of 6.1%.
Average Family Size Correlation Summary
| Measurement | Fijian | Albanian |
| Minimum | 2.00 | 1.90 |
| Maximum | 4.34 | 4.68 |
| Range | 2.34 | 2.78 |
| Mean | 3.42 | 3.14 |
| Median | 3.45 | 3.15 |
| Interquartile 25% (IQ1) | 3.28 | 3.08 |
| Interquartile 75% (IQ3) | 3.62 | 3.22 |
| Interquartile Range (IQR) | 0.34 | 0.15 |
| Standard Deviation (Sample) | 0.45 | 0.37 |
| Standard Deviation (Population) | 0.44 | 0.37 |
Similar Demographics by Average Family Size
Demographics Similar to Fijians by Average Family Size
In terms of average family size, the demographic groups most similar to Fijians are Korean (3.36, a difference of 0.030%), Nicaraguan (3.36, a difference of 0.050%), Immigrants from South Eastern Asia (3.36, a difference of 0.050%), Immigrants from Honduras (3.36, a difference of 0.090%), and Immigrants from Bangladesh (3.36, a difference of 0.13%).
| Demographics | Rating | Rank | Average Family Size |
| Shoshone | 100.0 /100 | #45 | Exceptional 3.37 |
| Haitians | 100.0 /100 | #46 | Exceptional 3.37 |
| Vietnamese | 100.0 /100 | #47 | Exceptional 3.37 |
| Immigrants | Nicaragua | 100.0 /100 | #48 | Exceptional 3.37 |
| Bangladeshis | 100.0 /100 | #49 | Exceptional 3.37 |
| Immigrants | Bangladesh | 100.0 /100 | #50 | Exceptional 3.36 |
| Nicaraguans | 100.0 /100 | #51 | Exceptional 3.36 |
| Fijians | 100.0 /100 | #52 | Exceptional 3.36 |
| Koreans | 100.0 /100 | #53 | Exceptional 3.36 |
| Immigrants | South Eastern Asia | 100.0 /100 | #54 | Exceptional 3.36 |
| Immigrants | Honduras | 100.0 /100 | #55 | Exceptional 3.36 |
| Immigrants | Dominican Republic | 100.0 /100 | #56 | Exceptional 3.35 |
| Sri Lankans | 100.0 /100 | #57 | Exceptional 3.35 |
| Hondurans | 100.0 /100 | #58 | Exceptional 3.35 |
| Japanese | 100.0 /100 | #59 | Exceptional 3.35 |
Demographics Similar to Albanians by Average Family Size
In terms of average family size, the demographic groups most similar to Albanians are Immigrants from Kazakhstan (3.17, a difference of 0.020%), Cape Verdean (3.17, a difference of 0.050%), Turkish (3.16, a difference of 0.050%), Potawatomi (3.16, a difference of 0.050%), and Immigrants from Hungary (3.17, a difference of 0.060%).
| Demographics | Rating | Rank | Average Family Size |
| Puget Sound Salish | 1.9 /100 | #250 | Tragic 3.17 |
| Immigrants | Spain | 1.8 /100 | #251 | Tragic 3.17 |
| Immigrants | Saudi Arabia | 1.7 /100 | #252 | Tragic 3.17 |
| South Africans | 1.7 /100 | #253 | Tragic 3.17 |
| Immigrants | Hungary | 1.7 /100 | #254 | Tragic 3.17 |
| Cape Verdeans | 1.6 /100 | #255 | Tragic 3.17 |
| Immigrants | Kazakhstan | 1.5 /100 | #256 | Tragic 3.17 |
| Albanians | 1.5 /100 | #257 | Tragic 3.17 |
| Turks | 1.3 /100 | #258 | Tragic 3.16 |
| Potawatomi | 1.3 /100 | #259 | Tragic 3.16 |
| Immigrants | Albania | 1.3 /100 | #260 | Tragic 3.16 |
| Immigrants | North Macedonia | 1.3 /100 | #261 | Tragic 3.16 |
| Immigrants | Russia | 1.3 /100 | #262 | Tragic 3.16 |
| Immigrants | Bulgaria | 1.0 /100 | #263 | Tragic 3.16 |
| Americans | 1.0 /100 | #264 | Tragic 3.16 |