Fijian vs Russian Master's Degree
COMPARE
Fijian
Russian
Master's Degree
Master's Degree Comparison
Fijians
Russians
10.3%
MASTER'S DEGREE
0.0/ 100
METRIC RATING
330th/ 347
METRIC RANK
19.5%
MASTER'S DEGREE
100.0/ 100
METRIC RATING
33rd/ 347
METRIC RANK
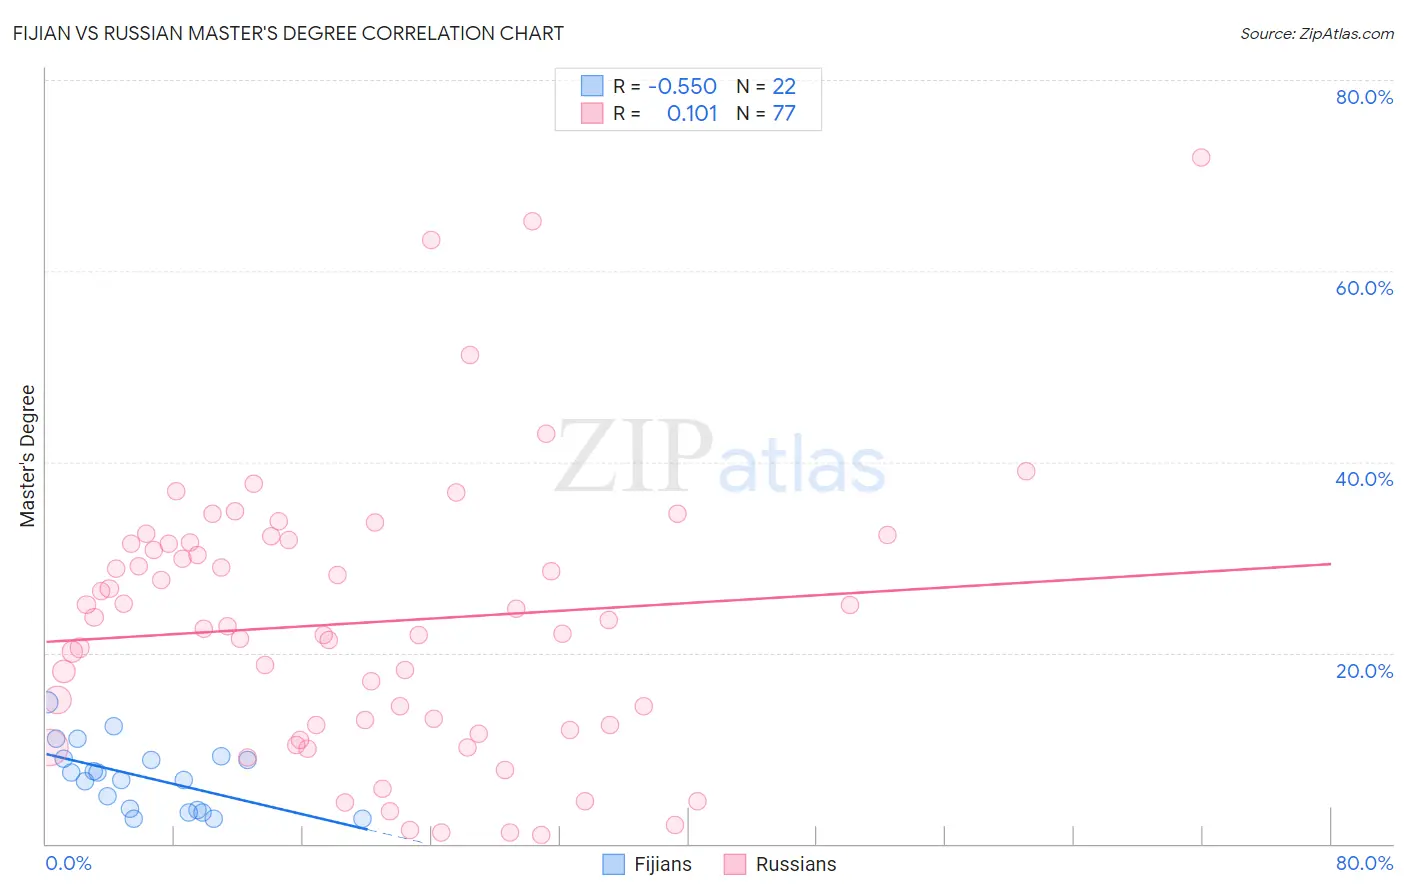
Fijian vs Russian Master's Degree Correlation Chart
The statistical analysis conducted on geographies consisting of 55,944,571 people shows a substantial negative correlation between the proportion of Fijians and percentage of population with at least master's degree education in the United States with a correlation coefficient (R) of -0.550 and weighted average of 10.3%. Similarly, the statistical analysis conducted on geographies consisting of 511,948,246 people shows a poor positive correlation between the proportion of Russians and percentage of population with at least master's degree education in the United States with a correlation coefficient (R) of 0.101 and weighted average of 19.5%, a difference of 89.9%.
Master's Degree Correlation Summary
| Measurement | Fijian | Russian |
| Minimum | 2.6% | 0.93% |
| Maximum | 14.8% | 71.9% |
| Range | 12.2% | 70.9% |
| Mean | 7.0% | 23.2% |
| Median | 7.1% | 22.8% |
| Interquartile 25% (IQ1) | 3.5% | 12.2% |
| Interquartile 75% (IQ3) | 8.9% | 31.5% |
| Interquartile Range (IQR) | 5.4% | 19.3% |
| Standard Deviation (Sample) | 3.4% | 14.4% |
| Standard Deviation (Population) | 3.4% | 14.3% |
Similar Demographics by Master's Degree
Demographics Similar to Fijians by Master's Degree
In terms of master's degree, the demographic groups most similar to Fijians are Pueblo (10.3%, a difference of 0.16%), Immigrants from the Azores (10.2%, a difference of 0.63%), Menominee (10.2%, a difference of 1.0%), Nepalese (10.5%, a difference of 1.7%), and Bangladeshi (10.5%, a difference of 1.8%).
| Demographics | Rating | Rank | Master's Degree |
| Crow | 0.0 /100 | #323 | Tragic 10.6% |
| Dutch West Indians | 0.0 /100 | #324 | Tragic 10.6% |
| Inupiat | 0.0 /100 | #325 | Tragic 10.5% |
| Creek | 0.0 /100 | #326 | Tragic 10.5% |
| Paiute | 0.0 /100 | #327 | Tragic 10.5% |
| Bangladeshis | 0.0 /100 | #328 | Tragic 10.5% |
| Nepalese | 0.0 /100 | #329 | Tragic 10.5% |
| Fijians | 0.0 /100 | #330 | Tragic 10.3% |
| Pueblo | 0.0 /100 | #331 | Tragic 10.3% |
| Immigrants | Azores | 0.0 /100 | #332 | Tragic 10.2% |
| Menominee | 0.0 /100 | #333 | Tragic 10.2% |
| Arapaho | 0.0 /100 | #334 | Tragic 10.0% |
| Immigrants | Central America | 0.0 /100 | #335 | Tragic 10.0% |
| Natives/Alaskans | 0.0 /100 | #336 | Tragic 9.9% |
| Mexicans | 0.0 /100 | #337 | Tragic 9.7% |
Demographics Similar to Russians by Master's Degree
In terms of master's degree, the demographic groups most similar to Russians are Immigrants from Denmark (19.5%, a difference of 0.030%), Immigrants from Northern Europe (19.5%, a difference of 0.36%), Immigrants from Russia (19.4%, a difference of 0.73%), Mongolian (19.4%, a difference of 0.77%), and Burmese (19.7%, a difference of 0.79%).
| Demographics | Rating | Rank | Master's Degree |
| Cambodians | 100.0 /100 | #26 | Exceptional 20.0% |
| Immigrants | Sri Lanka | 100.0 /100 | #27 | Exceptional 19.9% |
| Turks | 100.0 /100 | #28 | Exceptional 19.9% |
| Latvians | 100.0 /100 | #29 | Exceptional 19.8% |
| Immigrants | Turkey | 100.0 /100 | #30 | Exceptional 19.7% |
| Immigrants | Korea | 100.0 /100 | #31 | Exceptional 19.7% |
| Burmese | 100.0 /100 | #32 | Exceptional 19.7% |
| Russians | 100.0 /100 | #33 | Exceptional 19.5% |
| Immigrants | Denmark | 100.0 /100 | #34 | Exceptional 19.5% |
| Immigrants | Northern Europe | 100.0 /100 | #35 | Exceptional 19.5% |
| Immigrants | Russia | 100.0 /100 | #36 | Exceptional 19.4% |
| Mongolians | 100.0 /100 | #37 | Exceptional 19.4% |
| Bolivians | 100.0 /100 | #38 | Exceptional 19.3% |
| Immigrants | Spain | 100.0 /100 | #39 | Exceptional 19.1% |
| Immigrants | Bolivia | 100.0 /100 | #40 | Exceptional 19.1% |