Fijian vs Immigrants from Cabo Verde Average Family Size
COMPARE
Fijian
Immigrants from Cabo Verde
Average Family Size
Average Family Size Comparison
Fijians
Immigrants from Cabo Verde
3.36
AVERAGE FAMILY SIZE
100.0/ 100
METRIC RATING
52nd/ 347
METRIC RANK
3.20
AVERAGE FAMILY SIZE
16.0/ 100
METRIC RATING
206th/ 347
METRIC RANK
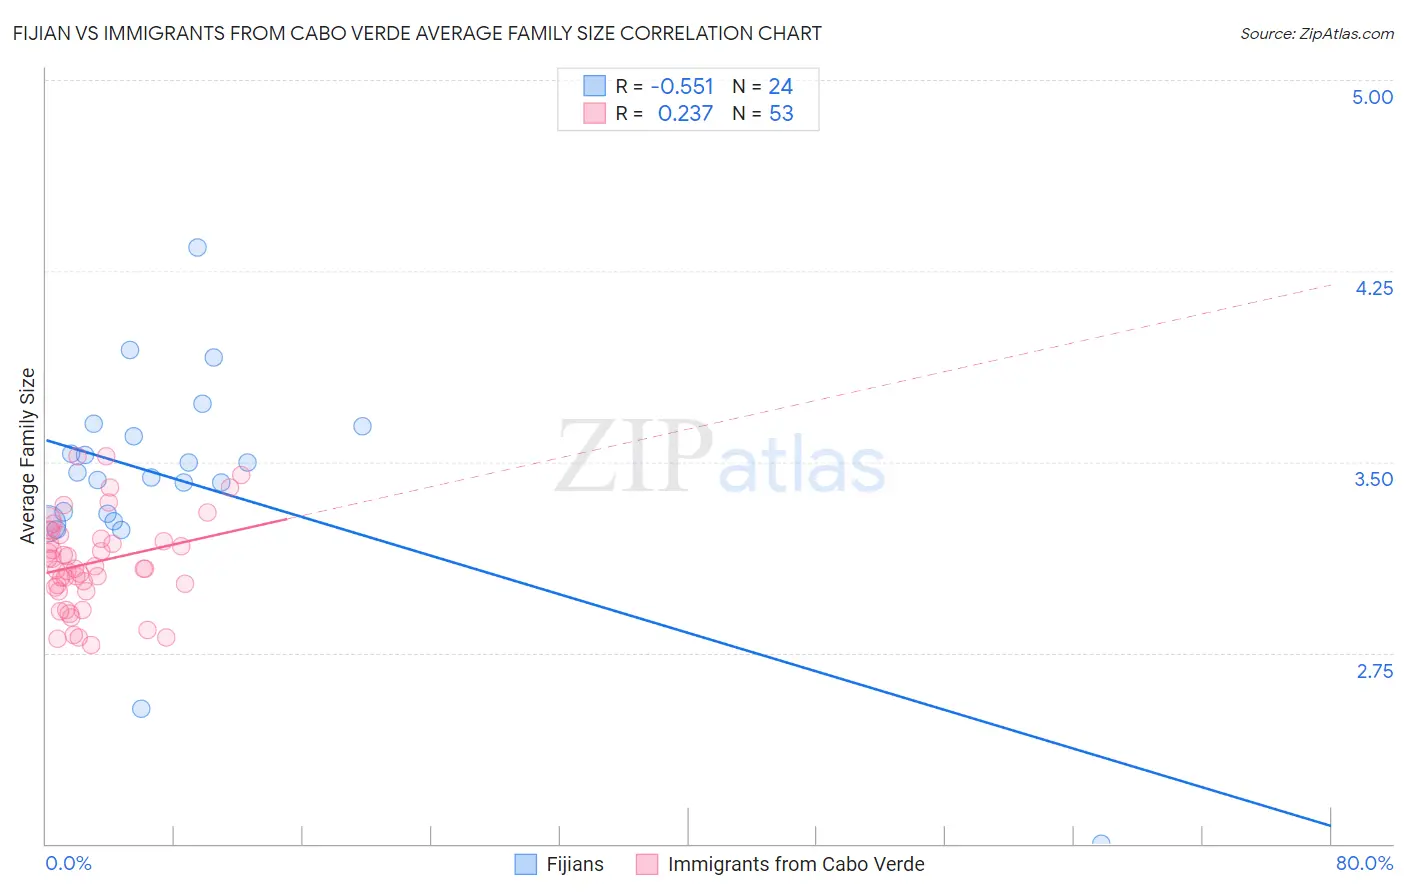
Fijian vs Immigrants from Cabo Verde Average Family Size Correlation Chart
The statistical analysis conducted on geographies consisting of 55,947,966 people shows a substantial negative correlation between the proportion of Fijians and average family size in the United States with a correlation coefficient (R) of -0.551 and weighted average of 3.36. Similarly, the statistical analysis conducted on geographies consisting of 38,135,369 people shows a weak positive correlation between the proportion of Immigrants from Cabo Verde and average family size in the United States with a correlation coefficient (R) of 0.237 and weighted average of 3.20, a difference of 4.9%.
Average Family Size Correlation Summary
| Measurement | Fijian | Immigrants from Cabo Verde |
| Minimum | 2.00 | 2.78 |
| Maximum | 4.34 | 3.52 |
| Range | 2.34 | 0.74 |
| Mean | 3.42 | 3.10 |
| Median | 3.45 | 3.08 |
| Interquartile 25% (IQ1) | 3.28 | 3.00 |
| Interquartile 75% (IQ3) | 3.62 | 3.21 |
| Interquartile Range (IQR) | 0.34 | 0.21 |
| Standard Deviation (Sample) | 0.45 | 0.18 |
| Standard Deviation (Population) | 0.44 | 0.18 |
Similar Demographics by Average Family Size
Demographics Similar to Fijians by Average Family Size
In terms of average family size, the demographic groups most similar to Fijians are Korean (3.36, a difference of 0.030%), Nicaraguan (3.36, a difference of 0.050%), Immigrants from South Eastern Asia (3.36, a difference of 0.050%), Immigrants from Honduras (3.36, a difference of 0.090%), and Immigrants from Bangladesh (3.36, a difference of 0.13%).
| Demographics | Rating | Rank | Average Family Size |
| Shoshone | 100.0 /100 | #45 | Exceptional 3.37 |
| Haitians | 100.0 /100 | #46 | Exceptional 3.37 |
| Vietnamese | 100.0 /100 | #47 | Exceptional 3.37 |
| Immigrants | Nicaragua | 100.0 /100 | #48 | Exceptional 3.37 |
| Bangladeshis | 100.0 /100 | #49 | Exceptional 3.37 |
| Immigrants | Bangladesh | 100.0 /100 | #50 | Exceptional 3.36 |
| Nicaraguans | 100.0 /100 | #51 | Exceptional 3.36 |
| Fijians | 100.0 /100 | #52 | Exceptional 3.36 |
| Koreans | 100.0 /100 | #53 | Exceptional 3.36 |
| Immigrants | South Eastern Asia | 100.0 /100 | #54 | Exceptional 3.36 |
| Immigrants | Honduras | 100.0 /100 | #55 | Exceptional 3.36 |
| Immigrants | Dominican Republic | 100.0 /100 | #56 | Exceptional 3.35 |
| Sri Lankans | 100.0 /100 | #57 | Exceptional 3.35 |
| Hondurans | 100.0 /100 | #58 | Exceptional 3.35 |
| Japanese | 100.0 /100 | #59 | Exceptional 3.35 |
Demographics Similar to Immigrants from Cabo Verde by Average Family Size
In terms of average family size, the demographic groups most similar to Immigrants from Cabo Verde are Paraguayan (3.20, a difference of 0.010%), Immigrants from Poland (3.20, a difference of 0.020%), Immigrants from Nepal (3.21, a difference of 0.070%), Immigrants from Morocco (3.21, a difference of 0.080%), and Immigrants from India (3.21, a difference of 0.080%).
| Demographics | Rating | Rank | Average Family Size |
| Hmong | 20.7 /100 | #199 | Fair 3.21 |
| Immigrants | Kenya | 19.2 /100 | #200 | Poor 3.21 |
| Immigrants | Morocco | 18.5 /100 | #201 | Poor 3.21 |
| Immigrants | India | 18.5 /100 | #202 | Poor 3.21 |
| Immigrants | Nepal | 18.1 /100 | #203 | Poor 3.21 |
| Immigrants | Poland | 16.6 /100 | #204 | Poor 3.20 |
| Paraguayans | 16.3 /100 | #205 | Poor 3.20 |
| Immigrants | Cabo Verde | 16.0 /100 | #206 | Poor 3.20 |
| Filipinos | 13.6 /100 | #207 | Poor 3.20 |
| Chippewa | 13.3 /100 | #208 | Poor 3.20 |
| Sudanese | 13.3 /100 | #209 | Poor 3.20 |
| Zimbabweans | 12.6 /100 | #210 | Poor 3.20 |
| Immigrants | Iran | 12.1 /100 | #211 | Poor 3.20 |
| Creek | 12.1 /100 | #212 | Poor 3.20 |
| Mongolians | 11.5 /100 | #213 | Poor 3.20 |