Fijian vs Malaysian Average Family Size
COMPARE
Fijian
Malaysian
Average Family Size
Average Family Size Comparison
Fijians
Malaysians
3.36
AVERAGE FAMILY SIZE
100.0/ 100
METRIC RATING
52nd/ 347
METRIC RANK
3.31
AVERAGE FAMILY SIZE
99.6/ 100
METRIC RATING
89th/ 347
METRIC RANK
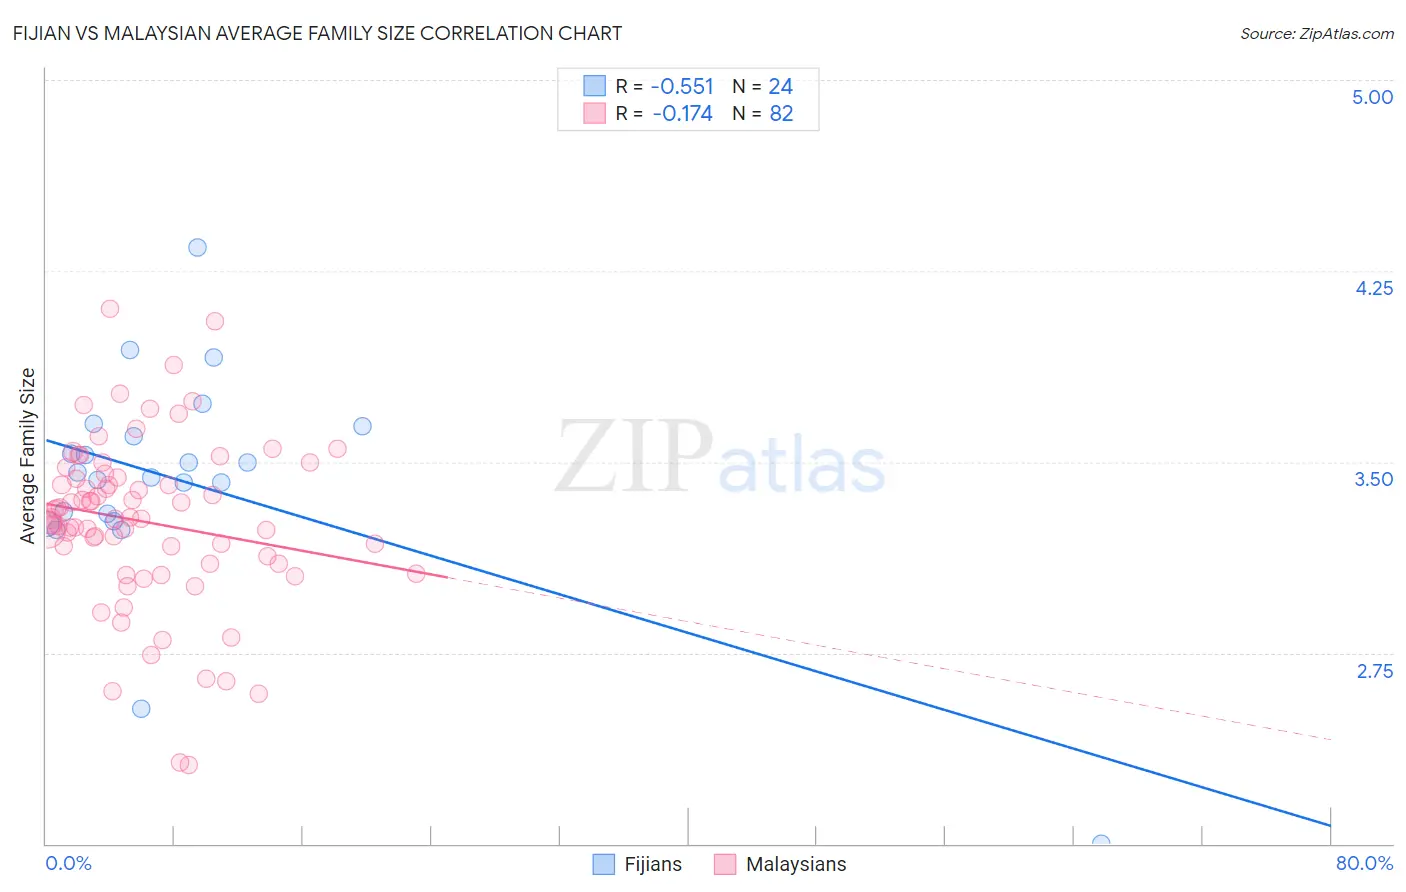
Fijian vs Malaysian Average Family Size Correlation Chart
The statistical analysis conducted on geographies consisting of 55,947,966 people shows a substantial negative correlation between the proportion of Fijians and average family size in the United States with a correlation coefficient (R) of -0.551 and weighted average of 3.36. Similarly, the statistical analysis conducted on geographies consisting of 226,011,671 people shows a poor negative correlation between the proportion of Malaysians and average family size in the United States with a correlation coefficient (R) of -0.174 and weighted average of 3.31, a difference of 1.5%.
Average Family Size Correlation Summary
| Measurement | Fijian | Malaysian |
| Minimum | 2.00 | 2.31 |
| Maximum | 4.34 | 4.10 |
| Range | 2.34 | 1.79 |
| Mean | 3.42 | 3.26 |
| Median | 3.45 | 3.28 |
| Interquartile 25% (IQ1) | 3.28 | 3.10 |
| Interquartile 75% (IQ3) | 3.62 | 3.44 |
| Interquartile Range (IQR) | 0.34 | 0.34 |
| Standard Deviation (Sample) | 0.45 | 0.33 |
| Standard Deviation (Population) | 0.44 | 0.33 |
Similar Demographics by Average Family Size
Demographics Similar to Fijians by Average Family Size
In terms of average family size, the demographic groups most similar to Fijians are Korean (3.36, a difference of 0.030%), Nicaraguan (3.36, a difference of 0.050%), Immigrants from South Eastern Asia (3.36, a difference of 0.050%), Immigrants from Honduras (3.36, a difference of 0.090%), and Immigrants from Bangladesh (3.36, a difference of 0.13%).
| Demographics | Rating | Rank | Average Family Size |
| Shoshone | 100.0 /100 | #45 | Exceptional 3.37 |
| Haitians | 100.0 /100 | #46 | Exceptional 3.37 |
| Vietnamese | 100.0 /100 | #47 | Exceptional 3.37 |
| Immigrants | Nicaragua | 100.0 /100 | #48 | Exceptional 3.37 |
| Bangladeshis | 100.0 /100 | #49 | Exceptional 3.37 |
| Immigrants | Bangladesh | 100.0 /100 | #50 | Exceptional 3.36 |
| Nicaraguans | 100.0 /100 | #51 | Exceptional 3.36 |
| Fijians | 100.0 /100 | #52 | Exceptional 3.36 |
| Koreans | 100.0 /100 | #53 | Exceptional 3.36 |
| Immigrants | South Eastern Asia | 100.0 /100 | #54 | Exceptional 3.36 |
| Immigrants | Honduras | 100.0 /100 | #55 | Exceptional 3.36 |
| Immigrants | Dominican Republic | 100.0 /100 | #56 | Exceptional 3.35 |
| Sri Lankans | 100.0 /100 | #57 | Exceptional 3.35 |
| Hondurans | 100.0 /100 | #58 | Exceptional 3.35 |
| Japanese | 100.0 /100 | #59 | Exceptional 3.35 |
Demographics Similar to Malaysians by Average Family Size
In terms of average family size, the demographic groups most similar to Malaysians are Immigrants from Bolivia (3.31, a difference of 0.010%), Immigrants from Peru (3.31, a difference of 0.10%), Menominee (3.30, a difference of 0.11%), Jamaican (3.31, a difference of 0.15%), and Afghan (3.31, a difference of 0.17%).
| Demographics | Rating | Rank | Average Family Size |
| Ecuadorians | 99.8 /100 | #82 | Exceptional 3.32 |
| Immigrants | Afghanistan | 99.8 /100 | #83 | Exceptional 3.32 |
| Immigrants | Nigeria | 99.7 /100 | #84 | Exceptional 3.32 |
| Afghans | 99.7 /100 | #85 | Exceptional 3.31 |
| Jamaicans | 99.7 /100 | #86 | Exceptional 3.31 |
| Immigrants | Peru | 99.7 /100 | #87 | Exceptional 3.31 |
| Immigrants | Bolivia | 99.6 /100 | #88 | Exceptional 3.31 |
| Malaysians | 99.6 /100 | #89 | Exceptional 3.31 |
| Menominee | 99.4 /100 | #90 | Exceptional 3.30 |
| Immigrants | Pakistan | 99.2 /100 | #91 | Exceptional 3.30 |
| Immigrants | Cameroon | 99.2 /100 | #92 | Exceptional 3.30 |
| Peruvians | 99.2 /100 | #93 | Exceptional 3.30 |
| Sierra Leoneans | 99.0 /100 | #94 | Exceptional 3.30 |
| Immigrants | Lebanon | 99.0 /100 | #95 | Exceptional 3.30 |
| U.S. Virgin Islanders | 98.8 /100 | #96 | Exceptional 3.29 |