Fijian vs Spaniard Average Family Size
COMPARE
Fijian
Spaniard
Average Family Size
Average Family Size Comparison
Fijians
Spaniards
3.36
AVERAGE FAMILY SIZE
100.0/ 100
METRIC RATING
52nd/ 347
METRIC RANK
3.23
AVERAGE FAMILY SIZE
47.2/ 100
METRIC RATING
178th/ 347
METRIC RANK
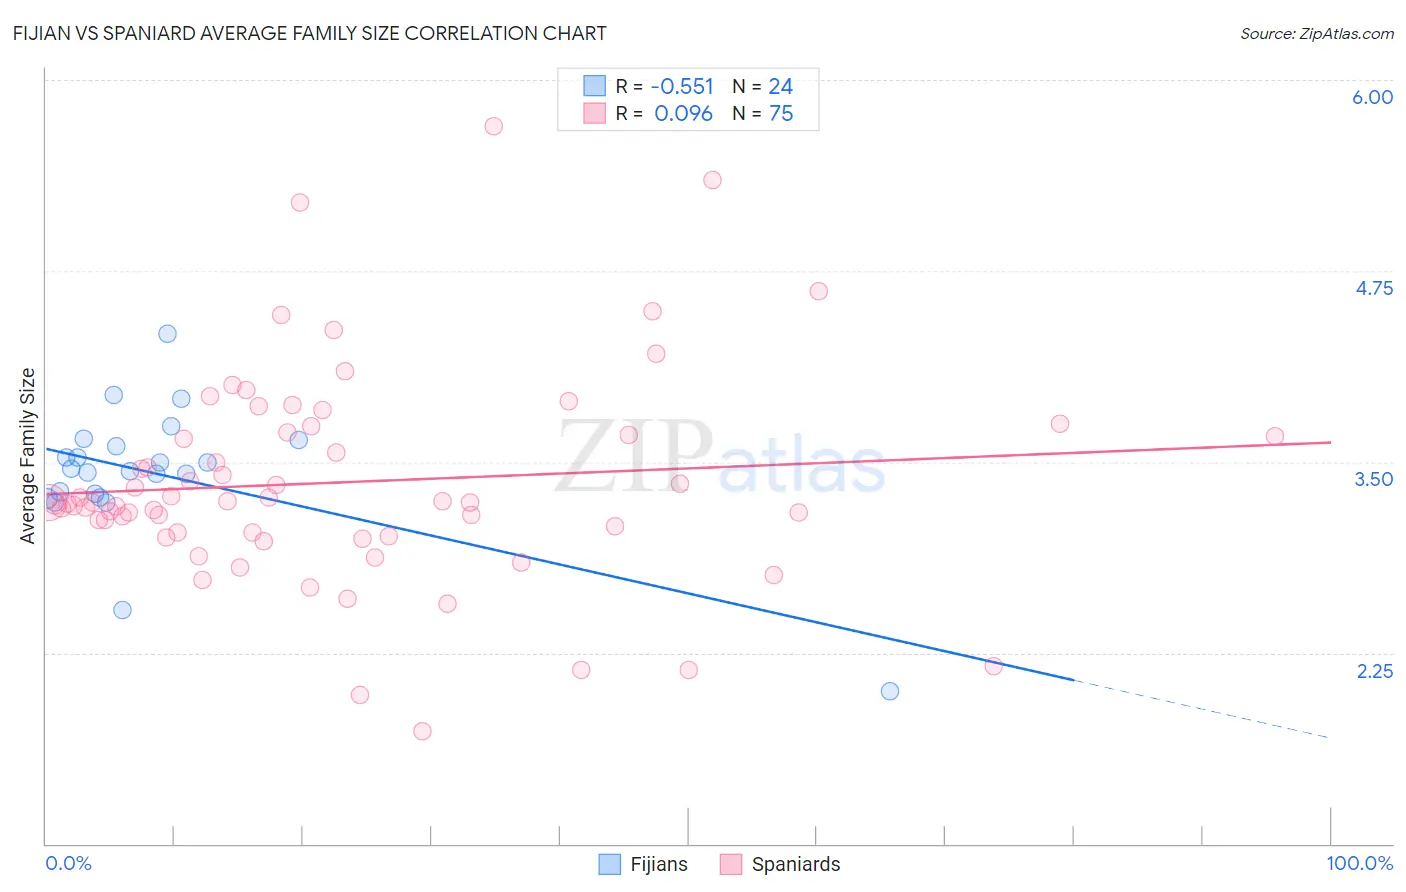
Fijian vs Spaniard Average Family Size Correlation Chart
The statistical analysis conducted on geographies consisting of 55,947,966 people shows a substantial negative correlation between the proportion of Fijians and average family size in the United States with a correlation coefficient (R) of -0.551 and weighted average of 3.36. Similarly, the statistical analysis conducted on geographies consisting of 443,170,080 people shows a slight positive correlation between the proportion of Spaniards and average family size in the United States with a correlation coefficient (R) of 0.096 and weighted average of 3.23, a difference of 4.1%.
Average Family Size Correlation Summary
| Measurement | Fijian | Spaniard |
| Minimum | 2.00 | 1.74 |
| Maximum | 4.34 | 5.70 |
| Range | 2.34 | 3.96 |
| Mean | 3.42 | 3.37 |
| Median | 3.45 | 3.23 |
| Interquartile 25% (IQ1) | 3.28 | 3.04 |
| Interquartile 75% (IQ3) | 3.62 | 3.69 |
| Interquartile Range (IQR) | 0.34 | 0.66 |
| Standard Deviation (Sample) | 0.45 | 0.70 |
| Standard Deviation (Population) | 0.44 | 0.69 |
Similar Demographics by Average Family Size
Demographics Similar to Fijians by Average Family Size
In terms of average family size, the demographic groups most similar to Fijians are Korean (3.36, a difference of 0.030%), Nicaraguan (3.36, a difference of 0.050%), Immigrants from South Eastern Asia (3.36, a difference of 0.050%), Immigrants from Honduras (3.36, a difference of 0.090%), and Immigrants from Bangladesh (3.36, a difference of 0.13%).
| Demographics | Rating | Rank | Average Family Size |
| Shoshone | 100.0 /100 | #45 | Exceptional 3.37 |
| Haitians | 100.0 /100 | #46 | Exceptional 3.37 |
| Vietnamese | 100.0 /100 | #47 | Exceptional 3.37 |
| Immigrants | Nicaragua | 100.0 /100 | #48 | Exceptional 3.37 |
| Bangladeshis | 100.0 /100 | #49 | Exceptional 3.37 |
| Immigrants | Bangladesh | 100.0 /100 | #50 | Exceptional 3.36 |
| Nicaraguans | 100.0 /100 | #51 | Exceptional 3.36 |
| Fijians | 100.0 /100 | #52 | Exceptional 3.36 |
| Koreans | 100.0 /100 | #53 | Exceptional 3.36 |
| Immigrants | South Eastern Asia | 100.0 /100 | #54 | Exceptional 3.36 |
| Immigrants | Honduras | 100.0 /100 | #55 | Exceptional 3.36 |
| Immigrants | Dominican Republic | 100.0 /100 | #56 | Exceptional 3.35 |
| Sri Lankans | 100.0 /100 | #57 | Exceptional 3.35 |
| Hondurans | 100.0 /100 | #58 | Exceptional 3.35 |
| Japanese | 100.0 /100 | #59 | Exceptional 3.35 |
Demographics Similar to Spaniards by Average Family Size
In terms of average family size, the demographic groups most similar to Spaniards are Argentinean (3.23, a difference of 0.0%), Immigrants from Korea (3.23, a difference of 0.010%), Palestinian (3.23, a difference of 0.010%), Israeli (3.23, a difference of 0.030%), and Spanish (3.23, a difference of 0.040%).
| Demographics | Rating | Rank | Average Family Size |
| Chileans | 53.2 /100 | #171 | Average 3.23 |
| Immigrants | Congo | 52.7 /100 | #172 | Average 3.23 |
| Immigrants | Uruguay | 52.0 /100 | #173 | Average 3.23 |
| Immigrants | South Central Asia | 50.0 /100 | #174 | Average 3.23 |
| Immigrants | China | 49.9 /100 | #175 | Average 3.23 |
| Israelis | 48.7 /100 | #176 | Average 3.23 |
| Argentineans | 47.4 /100 | #177 | Average 3.23 |
| Spaniards | 47.2 /100 | #178 | Average 3.23 |
| Immigrants | Korea | 46.9 /100 | #179 | Average 3.23 |
| Palestinians | 46.6 /100 | #180 | Average 3.23 |
| Spanish | 44.8 /100 | #181 | Average 3.23 |
| Moroccans | 44.2 /100 | #182 | Average 3.22 |
| Immigrants | Northern Africa | 41.7 /100 | #183 | Average 3.22 |
| Immigrants | Eastern Asia | 40.8 /100 | #184 | Average 3.22 |
| Immigrants | Sri Lanka | 39.8 /100 | #185 | Fair 3.22 |