Fijian vs Bhutanese Average Family Size
COMPARE
Fijian
Bhutanese
Average Family Size
Average Family Size Comparison
Fijians
Bhutanese
3.36
AVERAGE FAMILY SIZE
100.0/ 100
METRIC RATING
52nd/ 347
METRIC RANK
3.25
AVERAGE FAMILY SIZE
81.0/ 100
METRIC RATING
143rd/ 347
METRIC RANK
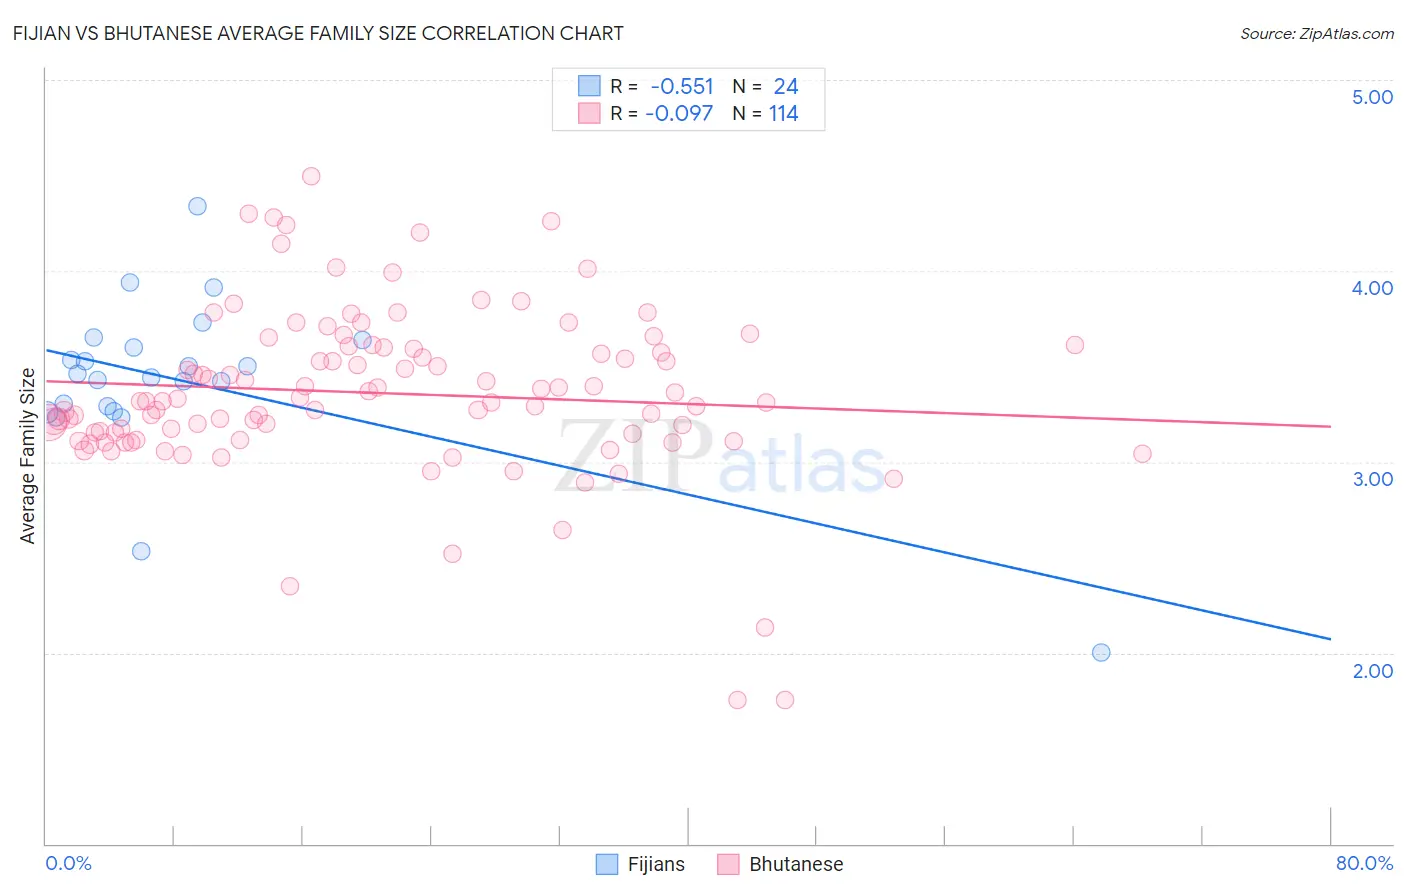
Fijian vs Bhutanese Average Family Size Correlation Chart
The statistical analysis conducted on geographies consisting of 55,947,966 people shows a substantial negative correlation between the proportion of Fijians and average family size in the United States with a correlation coefficient (R) of -0.551 and weighted average of 3.36. Similarly, the statistical analysis conducted on geographies consisting of 455,147,723 people shows a slight negative correlation between the proportion of Bhutanese and average family size in the United States with a correlation coefficient (R) of -0.097 and weighted average of 3.25, a difference of 3.4%.
Average Family Size Correlation Summary
| Measurement | Fijian | Bhutanese |
| Minimum | 2.00 | 1.75 |
| Maximum | 4.34 | 4.49 |
| Range | 2.34 | 2.74 |
| Mean | 3.42 | 3.36 |
| Median | 3.45 | 3.32 |
| Interquartile 25% (IQ1) | 3.28 | 3.15 |
| Interquartile 75% (IQ3) | 3.62 | 3.60 |
| Interquartile Range (IQR) | 0.34 | 0.45 |
| Standard Deviation (Sample) | 0.45 | 0.44 |
| Standard Deviation (Population) | 0.44 | 0.44 |
Similar Demographics by Average Family Size
Demographics Similar to Fijians by Average Family Size
In terms of average family size, the demographic groups most similar to Fijians are Korean (3.36, a difference of 0.030%), Nicaraguan (3.36, a difference of 0.050%), Immigrants from South Eastern Asia (3.36, a difference of 0.050%), Immigrants from Honduras (3.36, a difference of 0.090%), and Immigrants from Bangladesh (3.36, a difference of 0.13%).
| Demographics | Rating | Rank | Average Family Size |
| Shoshone | 100.0 /100 | #45 | Exceptional 3.37 |
| Haitians | 100.0 /100 | #46 | Exceptional 3.37 |
| Vietnamese | 100.0 /100 | #47 | Exceptional 3.37 |
| Immigrants | Nicaragua | 100.0 /100 | #48 | Exceptional 3.37 |
| Bangladeshis | 100.0 /100 | #49 | Exceptional 3.37 |
| Immigrants | Bangladesh | 100.0 /100 | #50 | Exceptional 3.36 |
| Nicaraguans | 100.0 /100 | #51 | Exceptional 3.36 |
| Fijians | 100.0 /100 | #52 | Exceptional 3.36 |
| Koreans | 100.0 /100 | #53 | Exceptional 3.36 |
| Immigrants | South Eastern Asia | 100.0 /100 | #54 | Exceptional 3.36 |
| Immigrants | Honduras | 100.0 /100 | #55 | Exceptional 3.36 |
| Immigrants | Dominican Republic | 100.0 /100 | #56 | Exceptional 3.35 |
| Sri Lankans | 100.0 /100 | #57 | Exceptional 3.35 |
| Hondurans | 100.0 /100 | #58 | Exceptional 3.35 |
| Japanese | 100.0 /100 | #59 | Exceptional 3.35 |
Demographics Similar to Bhutanese by Average Family Size
In terms of average family size, the demographic groups most similar to Bhutanese are Venezuelan (3.25, a difference of 0.010%), Liberian (3.25, a difference of 0.010%), Immigrants from Ethiopia (3.25, a difference of 0.020%), Subsaharan African (3.25, a difference of 0.020%), and Tsimshian (3.25, a difference of 0.020%).
| Demographics | Rating | Rank | Average Family Size |
| Comanche | 82.8 /100 | #136 | Excellent 3.25 |
| Immigrants | Middle Africa | 82.4 /100 | #137 | Excellent 3.25 |
| Cubans | 81.8 /100 | #138 | Excellent 3.25 |
| Immigrants | Ethiopia | 81.6 /100 | #139 | Excellent 3.25 |
| Sub-Saharan Africans | 81.6 /100 | #140 | Excellent 3.25 |
| Venezuelans | 81.4 /100 | #141 | Excellent 3.25 |
| Liberians | 81.2 /100 | #142 | Excellent 3.25 |
| Bhutanese | 81.0 /100 | #143 | Excellent 3.25 |
| Tsimshian | 80.2 /100 | #144 | Excellent 3.25 |
| Armenians | 78.2 /100 | #145 | Good 3.25 |
| Immigrants | Africa | 77.9 /100 | #146 | Good 3.25 |
| Immigrants | Jordan | 75.7 /100 | #147 | Good 3.24 |
| Blackfeet | 75.0 /100 | #148 | Good 3.24 |
| Assyrians/Chaldeans/Syriacs | 73.8 /100 | #149 | Good 3.24 |
| Indians (Asian) | 73.6 /100 | #150 | Good 3.24 |