Scandinavian vs Russian Average Family Size
COMPARE
Scandinavian
Russian
Average Family Size
Average Family Size Comparison
Scandinavians
Russians
3.14
AVERAGE FAMILY SIZE
0.2/ 100
METRIC RATING
293rd/ 347
METRIC RANK
3.12
AVERAGE FAMILY SIZE
0.1/ 100
METRIC RATING
314th/ 347
METRIC RANK
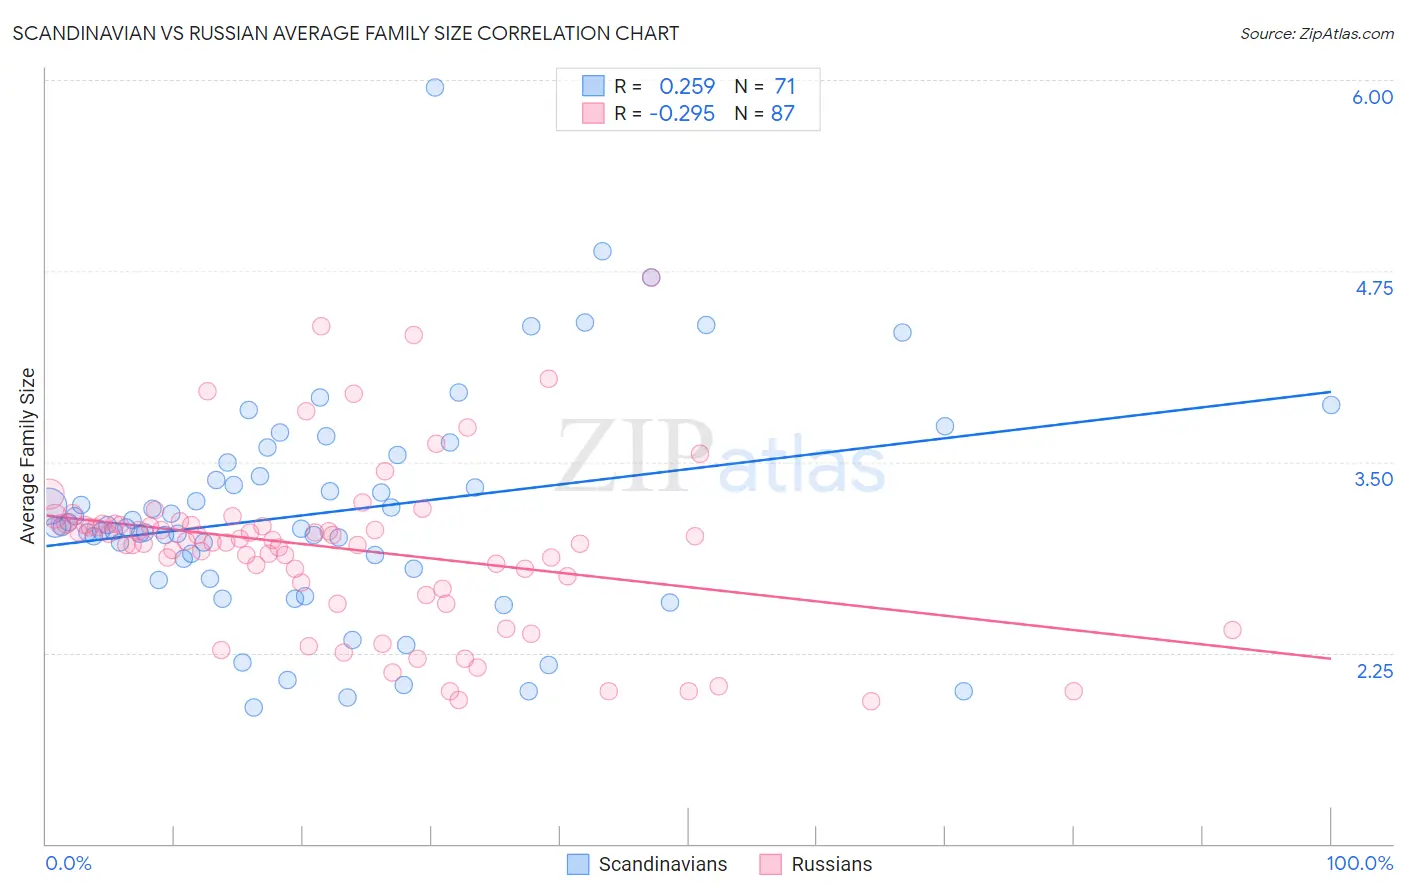
Scandinavian vs Russian Average Family Size Correlation Chart
The statistical analysis conducted on geographies consisting of 472,285,775 people shows a weak positive correlation between the proportion of Scandinavians and average family size in the United States with a correlation coefficient (R) of 0.259 and weighted average of 3.14. Similarly, the statistical analysis conducted on geographies consisting of 511,741,869 people shows a weak negative correlation between the proportion of Russians and average family size in the United States with a correlation coefficient (R) of -0.295 and weighted average of 3.12, a difference of 0.48%.
Average Family Size Correlation Summary
| Measurement | Scandinavian | Russian |
| Minimum | 1.89 | 1.93 |
| Maximum | 5.95 | 4.71 |
| Range | 4.06 | 2.78 |
| Mean | 3.17 | 2.93 |
| Median | 3.07 | 2.98 |
| Interquartile 25% (IQ1) | 2.80 | 2.67 |
| Interquartile 75% (IQ3) | 3.49 | 3.09 |
| Interquartile Range (IQR) | 0.69 | 0.42 |
| Standard Deviation (Sample) | 0.73 | 0.55 |
| Standard Deviation (Population) | 0.72 | 0.54 |
Similar Demographics by Average Family Size
Demographics Similar to Scandinavians by Average Family Size
In terms of average family size, the demographic groups most similar to Scandinavians are European (3.14, a difference of 0.010%), Immigrants from Croatia (3.14, a difference of 0.020%), Alsatian (3.14, a difference of 0.030%), Austrian (3.14, a difference of 0.030%), and Ukrainian (3.14, a difference of 0.030%).
| Demographics | Rating | Rank | Average Family Size |
| Immigrants | Netherlands | 0.3 /100 | #286 | Tragic 3.14 |
| Greeks | 0.3 /100 | #287 | Tragic 3.14 |
| Immigrants | Czechoslovakia | 0.3 /100 | #288 | Tragic 3.14 |
| Immigrants | Norway | 0.3 /100 | #289 | Tragic 3.14 |
| Cypriots | 0.3 /100 | #290 | Tragic 3.14 |
| Alsatians | 0.2 /100 | #291 | Tragic 3.14 |
| Europeans | 0.2 /100 | #292 | Tragic 3.14 |
| Scandinavians | 0.2 /100 | #293 | Tragic 3.14 |
| Immigrants | Croatia | 0.2 /100 | #294 | Tragic 3.14 |
| Austrians | 0.2 /100 | #295 | Tragic 3.14 |
| Ukrainians | 0.2 /100 | #296 | Tragic 3.14 |
| Immigrants | Western Europe | 0.2 /100 | #297 | Tragic 3.14 |
| Colville | 0.2 /100 | #298 | Tragic 3.14 |
| Canadians | 0.2 /100 | #299 | Tragic 3.14 |
| Immigrants | Sweden | 0.2 /100 | #300 | Tragic 3.14 |
Demographics Similar to Russians by Average Family Size
In terms of average family size, the demographic groups most similar to Russians are Immigrants from Scotland (3.12, a difference of 0.020%), Bulgarian (3.13, a difference of 0.040%), Immigrants from Australia (3.13, a difference of 0.050%), Immigrants from Northern Europe (3.13, a difference of 0.070%), and Czechoslovakian (3.13, a difference of 0.11%).
| Demographics | Rating | Rank | Average Family Size |
| Immigrants | Serbia | 0.1 /100 | #307 | Tragic 3.13 |
| Slavs | 0.1 /100 | #308 | Tragic 3.13 |
| Northern Europeans | 0.1 /100 | #309 | Tragic 3.13 |
| Czechoslovakians | 0.1 /100 | #310 | Tragic 3.13 |
| Immigrants | Northern Europe | 0.1 /100 | #311 | Tragic 3.13 |
| Immigrants | Australia | 0.1 /100 | #312 | Tragic 3.13 |
| Bulgarians | 0.1 /100 | #313 | Tragic 3.13 |
| Russians | 0.1 /100 | #314 | Tragic 3.12 |
| Immigrants | Scotland | 0.1 /100 | #315 | Tragic 3.12 |
| Serbians | 0.1 /100 | #316 | Tragic 3.12 |
| Italians | 0.1 /100 | #317 | Tragic 3.12 |
| Eastern Europeans | 0.1 /100 | #318 | Tragic 3.12 |
| Welsh | 0.1 /100 | #319 | Tragic 3.12 |
| Immigrants | North America | 0.0 /100 | #320 | Tragic 3.12 |
| Immigrants | Austria | 0.0 /100 | #321 | Tragic 3.12 |