Fijian vs Portuguese Average Family Size
COMPARE
Fijian
Portuguese
Average Family Size
Average Family Size Comparison
Fijians
Portuguese
3.36
AVERAGE FAMILY SIZE
100.0/ 100
METRIC RATING
52nd/ 347
METRIC RANK
3.19
AVERAGE FAMILY SIZE
6.0/ 100
METRIC RATING
227th/ 347
METRIC RANK
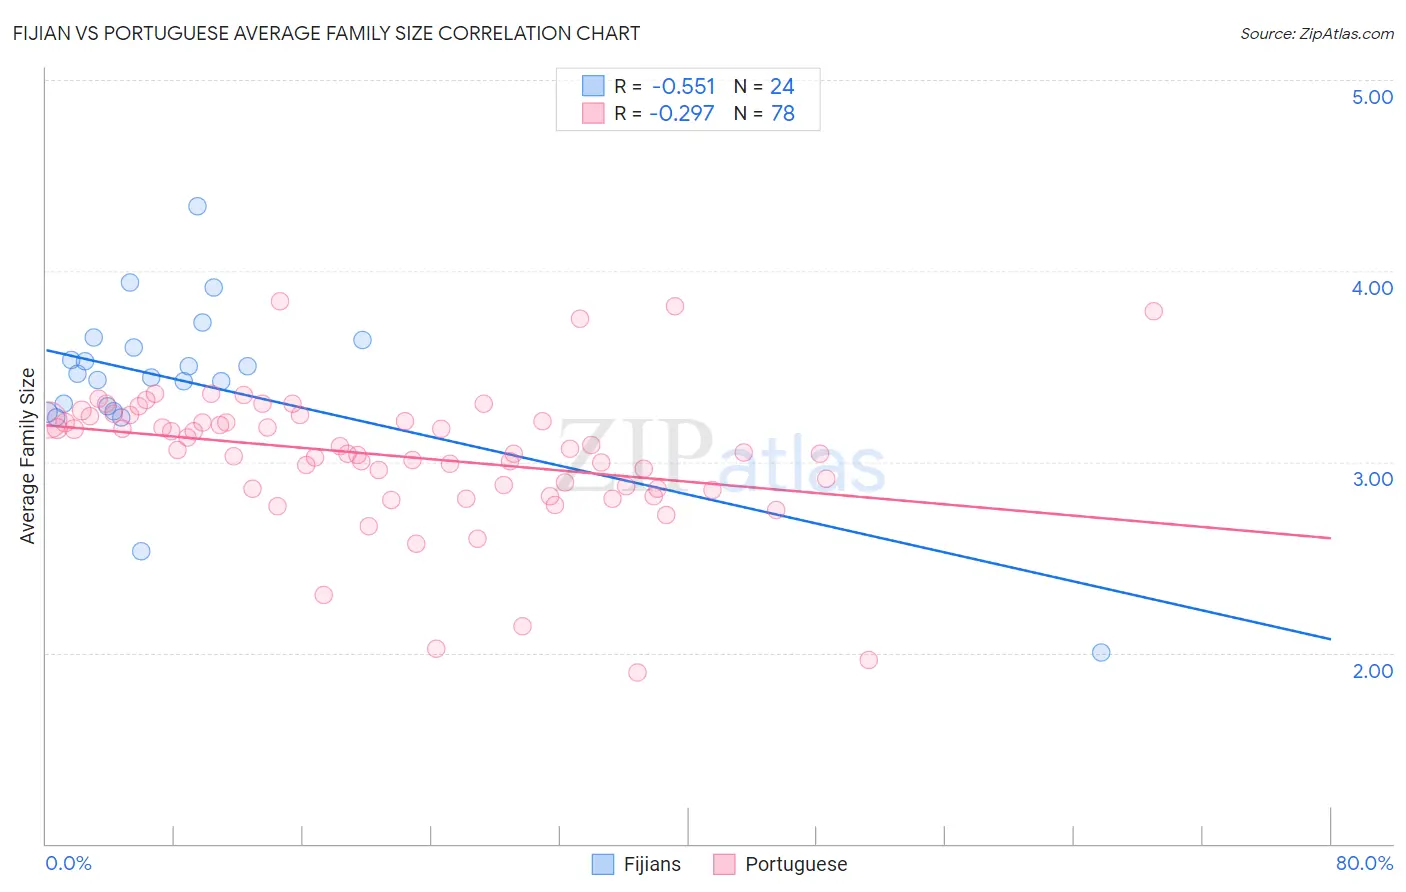
Fijian vs Portuguese Average Family Size Correlation Chart
The statistical analysis conducted on geographies consisting of 55,947,966 people shows a substantial negative correlation between the proportion of Fijians and average family size in the United States with a correlation coefficient (R) of -0.551 and weighted average of 3.36. Similarly, the statistical analysis conducted on geographies consisting of 449,985,413 people shows a weak negative correlation between the proportion of Portuguese and average family size in the United States with a correlation coefficient (R) of -0.297 and weighted average of 3.19, a difference of 5.4%.
Average Family Size Correlation Summary
| Measurement | Fijian | Portuguese |
| Minimum | 2.00 | 1.90 |
| Maximum | 4.34 | 3.84 |
| Range | 2.34 | 1.94 |
| Mean | 3.42 | 3.03 |
| Median | 3.45 | 3.06 |
| Interquartile 25% (IQ1) | 3.28 | 2.86 |
| Interquartile 75% (IQ3) | 3.62 | 3.22 |
| Interquartile Range (IQR) | 0.34 | 0.36 |
| Standard Deviation (Sample) | 0.45 | 0.36 |
| Standard Deviation (Population) | 0.44 | 0.36 |
Similar Demographics by Average Family Size
Demographics Similar to Fijians by Average Family Size
In terms of average family size, the demographic groups most similar to Fijians are Korean (3.36, a difference of 0.030%), Nicaraguan (3.36, a difference of 0.050%), Immigrants from South Eastern Asia (3.36, a difference of 0.050%), Immigrants from Honduras (3.36, a difference of 0.090%), and Immigrants from Bangladesh (3.36, a difference of 0.13%).
| Demographics | Rating | Rank | Average Family Size |
| Shoshone | 100.0 /100 | #45 | Exceptional 3.37 |
| Haitians | 100.0 /100 | #46 | Exceptional 3.37 |
| Vietnamese | 100.0 /100 | #47 | Exceptional 3.37 |
| Immigrants | Nicaragua | 100.0 /100 | #48 | Exceptional 3.37 |
| Bangladeshis | 100.0 /100 | #49 | Exceptional 3.37 |
| Immigrants | Bangladesh | 100.0 /100 | #50 | Exceptional 3.36 |
| Nicaraguans | 100.0 /100 | #51 | Exceptional 3.36 |
| Fijians | 100.0 /100 | #52 | Exceptional 3.36 |
| Koreans | 100.0 /100 | #53 | Exceptional 3.36 |
| Immigrants | South Eastern Asia | 100.0 /100 | #54 | Exceptional 3.36 |
| Immigrants | Honduras | 100.0 /100 | #55 | Exceptional 3.36 |
| Immigrants | Dominican Republic | 100.0 /100 | #56 | Exceptional 3.35 |
| Sri Lankans | 100.0 /100 | #57 | Exceptional 3.35 |
| Hondurans | 100.0 /100 | #58 | Exceptional 3.35 |
| Japanese | 100.0 /100 | #59 | Exceptional 3.35 |
Demographics Similar to Portuguese by Average Family Size
In terms of average family size, the demographic groups most similar to Portuguese are Chickasaw (3.19, a difference of 0.0%), Cree (3.19, a difference of 0.020%), Nonimmigrants (3.19, a difference of 0.020%), Syrian (3.19, a difference of 0.040%), and Immigrants from Italy (3.19, a difference of 0.060%).
| Demographics | Rating | Rank | Average Family Size |
| Lebanese | 9.1 /100 | #220 | Tragic 3.19 |
| Immigrants | Ukraine | 7.2 /100 | #221 | Tragic 3.19 |
| Immigrants | Kuwait | 7.2 /100 | #222 | Tragic 3.19 |
| Immigrants | Zimbabwe | 7.1 /100 | #223 | Tragic 3.19 |
| Syrians | 6.5 /100 | #224 | Tragic 3.19 |
| Cree | 6.2 /100 | #225 | Tragic 3.19 |
| Chickasaw | 6.0 /100 | #226 | Tragic 3.19 |
| Portuguese | 6.0 /100 | #227 | Tragic 3.19 |
| Immigrants | Nonimmigrants | 5.7 /100 | #228 | Tragic 3.19 |
| Immigrants | Italy | 5.3 /100 | #229 | Tragic 3.19 |
| Icelanders | 5.2 /100 | #230 | Tragic 3.19 |
| Basques | 5.2 /100 | #231 | Tragic 3.19 |
| Cherokee | 4.7 /100 | #232 | Tragic 3.18 |
| Brazilians | 4.5 /100 | #233 | Tragic 3.18 |
| Iranians | 4.5 /100 | #234 | Tragic 3.18 |