Czech vs Russian Average Family Size
COMPARE
Czech
Russian
Average Family Size
Average Family Size Comparison
Czechs
Russians
3.11
AVERAGE FAMILY SIZE
0.0/ 100
METRIC RATING
328th/ 347
METRIC RANK
3.12
AVERAGE FAMILY SIZE
0.1/ 100
METRIC RATING
314th/ 347
METRIC RANK
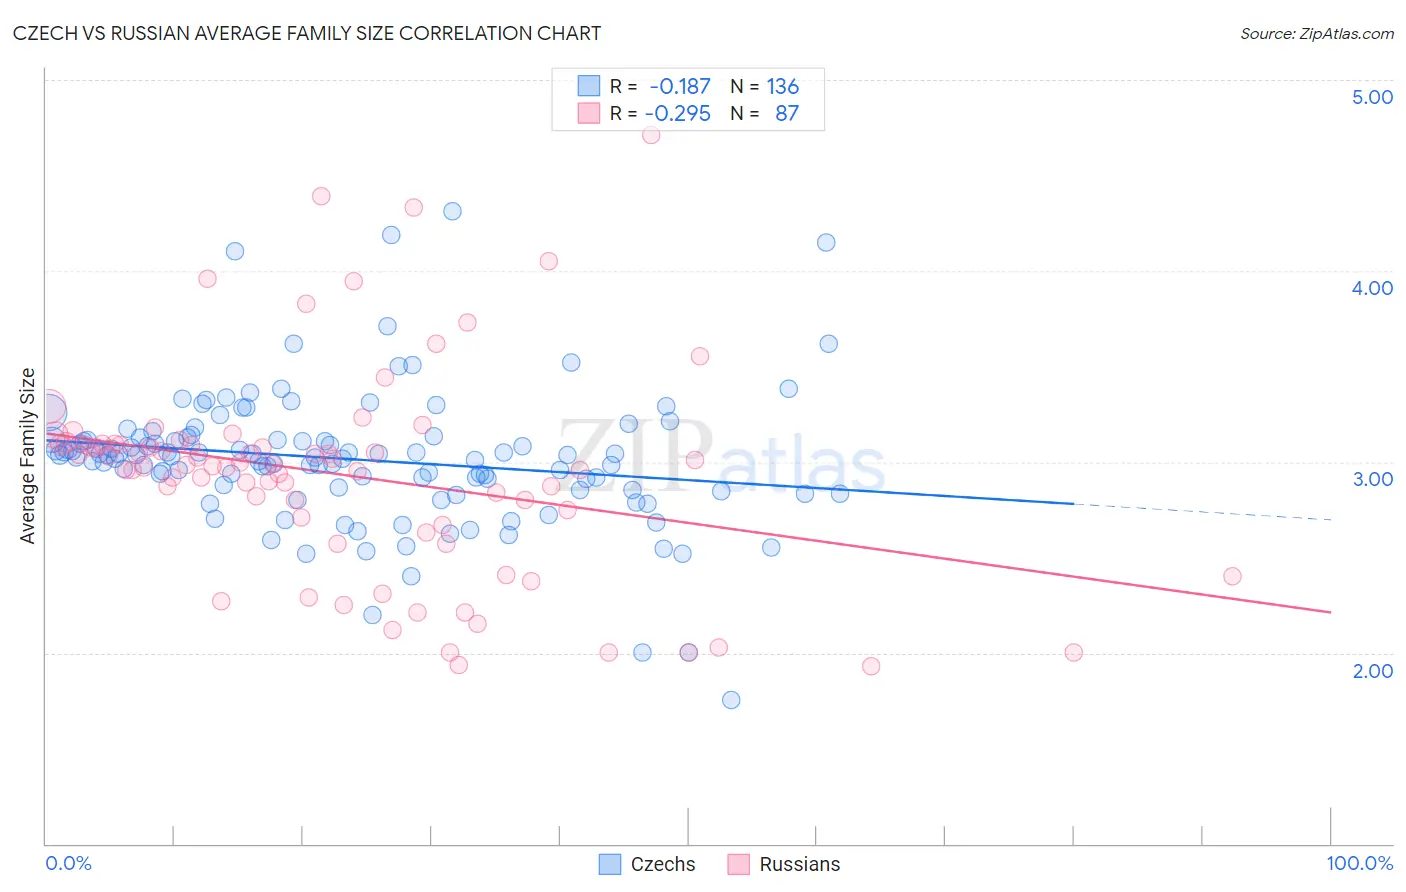
Czech vs Russian Average Family Size Correlation Chart
The statistical analysis conducted on geographies consisting of 484,474,906 people shows a poor negative correlation between the proportion of Czechs and average family size in the United States with a correlation coefficient (R) of -0.187 and weighted average of 3.11. Similarly, the statistical analysis conducted on geographies consisting of 511,741,869 people shows a weak negative correlation between the proportion of Russians and average family size in the United States with a correlation coefficient (R) of -0.295 and weighted average of 3.12, a difference of 0.49%.
Average Family Size Correlation Summary
| Measurement | Czech | Russian |
| Minimum | 1.75 | 1.93 |
| Maximum | 4.31 | 4.71 |
| Range | 2.56 | 2.78 |
| Mean | 3.01 | 2.93 |
| Median | 3.03 | 2.98 |
| Interquartile 25% (IQ1) | 2.86 | 2.67 |
| Interquartile 75% (IQ3) | 3.12 | 3.09 |
| Interquartile Range (IQR) | 0.26 | 0.42 |
| Standard Deviation (Sample) | 0.36 | 0.55 |
| Standard Deviation (Population) | 0.36 | 0.54 |
Demographics Similar to Czechs and Russians by Average Family Size
In terms of average family size, the demographic groups most similar to Czechs are Dutch (3.11, a difference of 0.0%), Ottawa (3.11, a difference of 0.010%), English (3.11, a difference of 0.060%), Belgian (3.11, a difference of 0.060%), and Celtic (3.11, a difference of 0.10%). Similarly, the demographic groups most similar to Russians are Immigrants from Scotland (3.12, a difference of 0.020%), Bulgarian (3.13, a difference of 0.040%), Immigrants from Australia (3.13, a difference of 0.050%), Immigrants from Northern Europe (3.13, a difference of 0.070%), and Serbian (3.12, a difference of 0.11%).
| Demographics | Rating | Rank | Average Family Size |
| Immigrants | Northern Europe | 0.1 /100 | #311 | Tragic 3.13 |
| Immigrants | Australia | 0.1 /100 | #312 | Tragic 3.13 |
| Bulgarians | 0.1 /100 | #313 | Tragic 3.13 |
| Russians | 0.1 /100 | #314 | Tragic 3.12 |
| Immigrants | Scotland | 0.1 /100 | #315 | Tragic 3.12 |
| Serbians | 0.1 /100 | #316 | Tragic 3.12 |
| Italians | 0.1 /100 | #317 | Tragic 3.12 |
| Eastern Europeans | 0.1 /100 | #318 | Tragic 3.12 |
| Welsh | 0.1 /100 | #319 | Tragic 3.12 |
| Immigrants | North America | 0.0 /100 | #320 | Tragic 3.12 |
| Immigrants | Austria | 0.0 /100 | #321 | Tragic 3.12 |
| Immigrants | Canada | 0.0 /100 | #322 | Tragic 3.12 |
| Soviet Union | 0.0 /100 | #323 | Tragic 3.11 |
| Celtics | 0.0 /100 | #324 | Tragic 3.11 |
| English | 0.0 /100 | #325 | Tragic 3.11 |
| Ottawa | 0.0 /100 | #326 | Tragic 3.11 |
| Dutch | 0.0 /100 | #327 | Tragic 3.11 |
| Czechs | 0.0 /100 | #328 | Tragic 3.11 |
| Belgians | 0.0 /100 | #329 | Tragic 3.11 |
| Latvians | 0.0 /100 | #330 | Tragic 3.11 |
| Scotch-Irish | 0.0 /100 | #331 | Tragic 3.11 |