Fijian vs Kiowa Average Family Size
COMPARE
Fijian
Kiowa
Average Family Size
Average Family Size Comparison
Fijians
Kiowa
3.36
AVERAGE FAMILY SIZE
100.0/ 100
METRIC RATING
52nd/ 347
METRIC RANK
3.27
AVERAGE FAMILY SIZE
94.8/ 100
METRIC RATING
117th/ 347
METRIC RANK
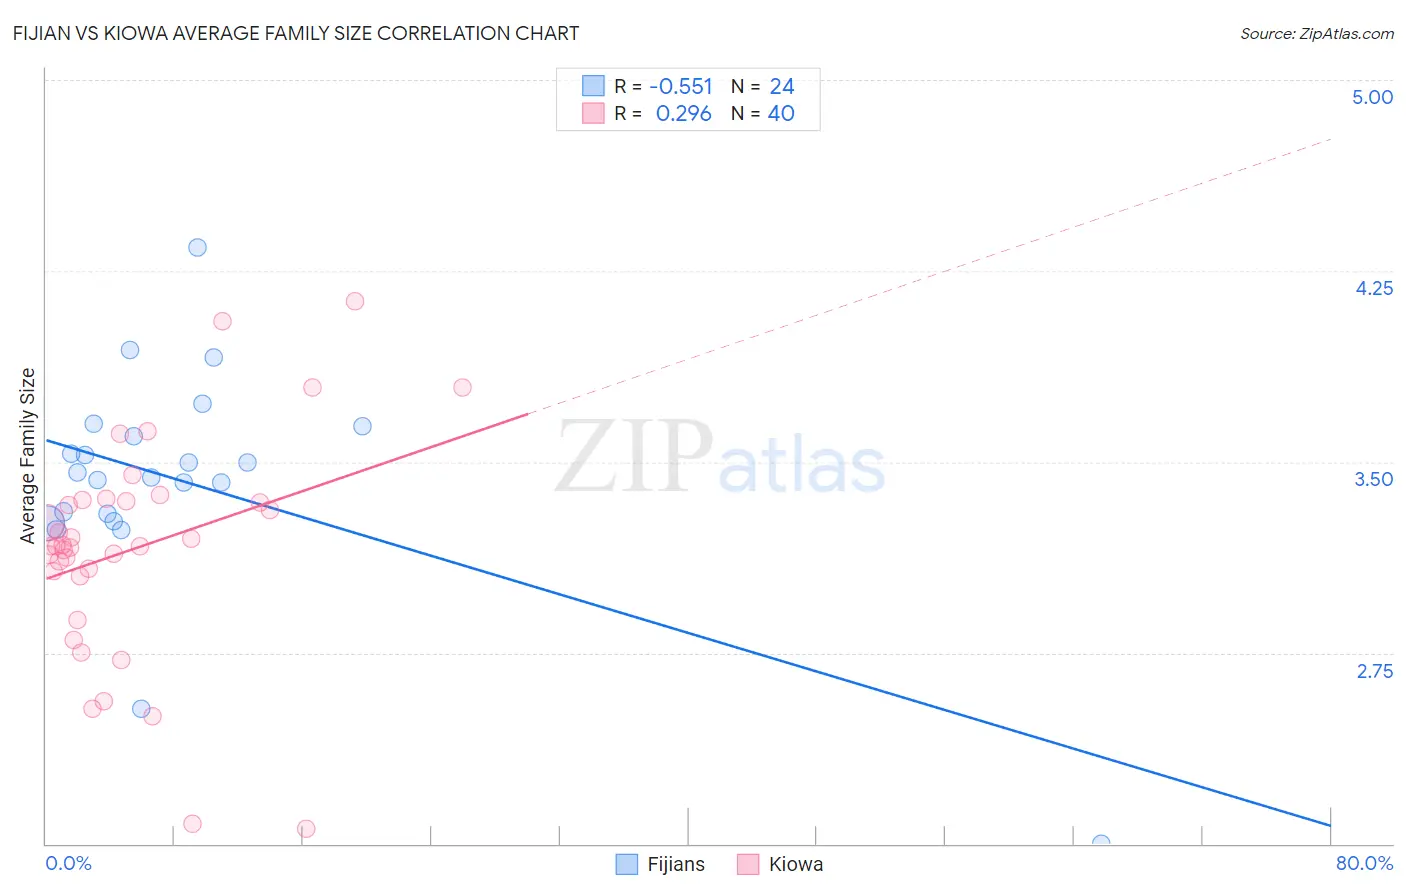
Fijian vs Kiowa Average Family Size Correlation Chart
The statistical analysis conducted on geographies consisting of 55,947,966 people shows a substantial negative correlation between the proportion of Fijians and average family size in the United States with a correlation coefficient (R) of -0.551 and weighted average of 3.36. Similarly, the statistical analysis conducted on geographies consisting of 56,098,854 people shows a weak positive correlation between the proportion of Kiowa and average family size in the United States with a correlation coefficient (R) of 0.296 and weighted average of 3.27, a difference of 2.7%.
Average Family Size Correlation Summary
| Measurement | Fijian | Kiowa |
| Minimum | 2.00 | 2.06 |
| Maximum | 4.34 | 4.13 |
| Range | 2.34 | 2.07 |
| Mean | 3.42 | 3.16 |
| Median | 3.45 | 3.17 |
| Interquartile 25% (IQ1) | 3.28 | 3.06 |
| Interquartile 75% (IQ3) | 3.62 | 3.35 |
| Interquartile Range (IQR) | 0.34 | 0.29 |
| Standard Deviation (Sample) | 0.45 | 0.44 |
| Standard Deviation (Population) | 0.44 | 0.43 |
Similar Demographics by Average Family Size
Demographics Similar to Fijians by Average Family Size
In terms of average family size, the demographic groups most similar to Fijians are Korean (3.36, a difference of 0.030%), Nicaraguan (3.36, a difference of 0.050%), Immigrants from South Eastern Asia (3.36, a difference of 0.050%), Immigrants from Honduras (3.36, a difference of 0.090%), and Immigrants from Bangladesh (3.36, a difference of 0.13%).
| Demographics | Rating | Rank | Average Family Size |
| Shoshone | 100.0 /100 | #45 | Exceptional 3.37 |
| Haitians | 100.0 /100 | #46 | Exceptional 3.37 |
| Vietnamese | 100.0 /100 | #47 | Exceptional 3.37 |
| Immigrants | Nicaragua | 100.0 /100 | #48 | Exceptional 3.37 |
| Bangladeshis | 100.0 /100 | #49 | Exceptional 3.37 |
| Immigrants | Bangladesh | 100.0 /100 | #50 | Exceptional 3.36 |
| Nicaraguans | 100.0 /100 | #51 | Exceptional 3.36 |
| Fijians | 100.0 /100 | #52 | Exceptional 3.36 |
| Koreans | 100.0 /100 | #53 | Exceptional 3.36 |
| Immigrants | South Eastern Asia | 100.0 /100 | #54 | Exceptional 3.36 |
| Immigrants | Honduras | 100.0 /100 | #55 | Exceptional 3.36 |
| Immigrants | Dominican Republic | 100.0 /100 | #56 | Exceptional 3.35 |
| Sri Lankans | 100.0 /100 | #57 | Exceptional 3.35 |
| Hondurans | 100.0 /100 | #58 | Exceptional 3.35 |
| Japanese | 100.0 /100 | #59 | Exceptional 3.35 |
Demographics Similar to Kiowa by Average Family Size
In terms of average family size, the demographic groups most similar to Kiowa are Immigrants from Liberia (3.27, a difference of 0.020%), Immigrants from South America (3.27, a difference of 0.020%), South American (3.27, a difference of 0.030%), Immigrants from Asia (3.27, a difference of 0.070%), and Immigrants from Panama (3.27, a difference of 0.080%).
| Demographics | Rating | Rank | Average Family Size |
| Bahamians | 96.6 /100 | #110 | Exceptional 3.28 |
| Indonesians | 96.2 /100 | #111 | Exceptional 3.28 |
| Blacks/African Americans | 95.7 /100 | #112 | Exceptional 3.27 |
| Immigrants | Panama | 95.6 /100 | #113 | Exceptional 3.27 |
| South Americans | 95.1 /100 | #114 | Exceptional 3.27 |
| Immigrants | Liberia | 95.0 /100 | #115 | Exceptional 3.27 |
| Immigrants | South America | 95.0 /100 | #116 | Exceptional 3.27 |
| Kiowa | 94.8 /100 | #117 | Exceptional 3.27 |
| Immigrants | Asia | 94.0 /100 | #118 | Exceptional 3.27 |
| Immigrants | Indonesia | 93.7 /100 | #119 | Exceptional 3.27 |
| Immigrants | Bahamas | 93.6 /100 | #120 | Exceptional 3.27 |
| Immigrants | Thailand | 93.3 /100 | #121 | Exceptional 3.27 |
| Immigrants | Colombia | 92.8 /100 | #122 | Exceptional 3.27 |
| Alaskan Athabascans | 92.4 /100 | #123 | Exceptional 3.27 |
| South American Indians | 91.6 /100 | #124 | Exceptional 3.26 |