Burmese vs Slovene Currently Married
COMPARE
Burmese
Slovene
Currently Married
Currently Married Comparison
Burmese
Slovenes
48.9%
CURRENTLY MARRIED
99.6/ 100
METRIC RATING
27th/ 347
METRIC RANK
48.1%
CURRENTLY MARRIED
97.1/ 100
METRIC RATING
77th/ 347
METRIC RANK
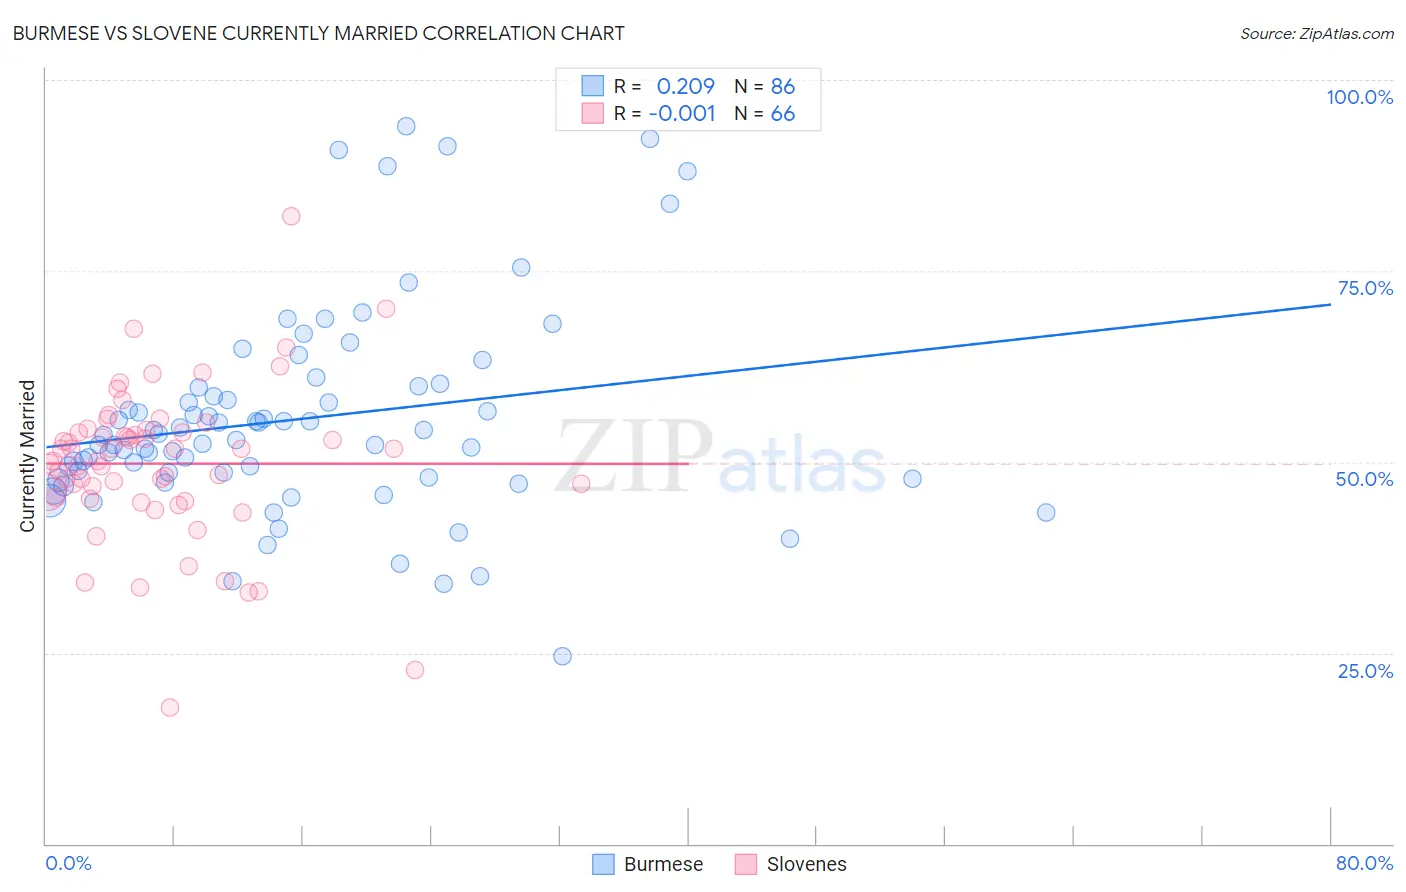
Burmese vs Slovene Currently Married Correlation Chart
The statistical analysis conducted on geographies consisting of 465,297,934 people shows a weak positive correlation between the proportion of Burmese and percentage of population currently married in the United States with a correlation coefficient (R) of 0.209 and weighted average of 48.9%. Similarly, the statistical analysis conducted on geographies consisting of 261,329,458 people shows no correlation between the proportion of Slovenes and percentage of population currently married in the United States with a correlation coefficient (R) of -0.001 and weighted average of 48.1%, a difference of 1.7%.
Currently Married Correlation Summary
| Measurement | Burmese | Slovene |
| Minimum | 24.6% | 17.9% |
| Maximum | 93.9% | 82.2% |
| Range | 69.3% | 64.3% |
| Mean | 55.6% | 49.8% |
| Median | 53.2% | 50.9% |
| Interquartile 25% (IQ1) | 48.0% | 45.4% |
| Interquartile 75% (IQ3) | 59.7% | 53.8% |
| Interquartile Range (IQR) | 11.7% | 8.5% |
| Standard Deviation (Sample) | 13.6% | 10.2% |
| Standard Deviation (Population) | 13.5% | 10.1% |
Similar Demographics by Currently Married
Demographics Similar to Burmese by Currently Married
In terms of currently married, the demographic groups most similar to Burmese are Welsh (48.9%, a difference of 0.040%), Immigrants from Korea (49.0%, a difference of 0.070%), Croatian (48.9%, a difference of 0.090%), Eastern European (48.9%, a difference of 0.10%), and Polish (48.9%, a difference of 0.10%).
| Demographics | Rating | Rank | Currently Married |
| Luxembourgers | 99.8 /100 | #20 | Exceptional 49.3% |
| Scottish | 99.8 /100 | #21 | Exceptional 49.2% |
| Bulgarians | 99.7 /100 | #22 | Exceptional 49.1% |
| Immigrants | Pakistan | 99.7 /100 | #23 | Exceptional 49.1% |
| Lithuanians | 99.6 /100 | #24 | Exceptional 49.0% |
| Maltese | 99.6 /100 | #25 | Exceptional 49.0% |
| Immigrants | Korea | 99.6 /100 | #26 | Exceptional 49.0% |
| Burmese | 99.6 /100 | #27 | Exceptional 48.9% |
| Welsh | 99.5 /100 | #28 | Exceptional 48.9% |
| Croatians | 99.5 /100 | #29 | Exceptional 48.9% |
| Eastern Europeans | 99.5 /100 | #30 | Exceptional 48.9% |
| Poles | 99.5 /100 | #31 | Exceptional 48.9% |
| Immigrants | Hong Kong | 99.5 /100 | #32 | Exceptional 48.9% |
| Irish | 99.5 /100 | #33 | Exceptional 48.9% |
| Immigrants | Lithuania | 99.4 /100 | #34 | Exceptional 48.8% |
Demographics Similar to Slovenes by Currently Married
In terms of currently married, the demographic groups most similar to Slovenes are Immigrants from Belgium (48.1%, a difference of 0.010%), Basque (48.1%, a difference of 0.020%), Immigrants from South Africa (48.1%, a difference of 0.020%), Immigrants from Belarus (48.1%, a difference of 0.050%), and Immigrants from Poland (48.1%, a difference of 0.050%).
| Demographics | Rating | Rank | Currently Married |
| Immigrants | Asia | 97.9 /100 | #70 | Exceptional 48.3% |
| Macedonians | 97.9 /100 | #71 | Exceptional 48.3% |
| Immigrants | Lebanon | 97.6 /100 | #72 | Exceptional 48.2% |
| Immigrants | Eastern Asia | 97.5 /100 | #73 | Exceptional 48.2% |
| Estonians | 97.4 /100 | #74 | Exceptional 48.2% |
| Immigrants | Belarus | 97.2 /100 | #75 | Exceptional 48.1% |
| Basques | 97.2 /100 | #76 | Exceptional 48.1% |
| Slovenes | 97.1 /100 | #77 | Exceptional 48.1% |
| Immigrants | Belgium | 97.1 /100 | #78 | Exceptional 48.1% |
| Immigrants | South Africa | 97.0 /100 | #79 | Exceptional 48.1% |
| Immigrants | Poland | 96.9 /100 | #80 | Exceptional 48.1% |
| Immigrants | Sri Lanka | 96.9 /100 | #81 | Exceptional 48.1% |
| Immigrants | Europe | 96.9 /100 | #82 | Exceptional 48.1% |
| Bolivians | 96.9 /100 | #83 | Exceptional 48.1% |
| Immigrants | Israel | 96.9 /100 | #84 | Exceptional 48.1% |