Ethiopian vs Slovene Divorced or Separated
COMPARE
Ethiopian
Slovene
Divorced or Separated
Divorced or Separated Comparison
Ethiopians
Slovenes
12.0%
DIVORCED OR SEPARATED
58.5/ 100
METRIC RATING
167th/ 347
METRIC RANK
12.3%
DIVORCED OR SEPARATED
13.2/ 100
METRIC RATING
218th/ 347
METRIC RANK
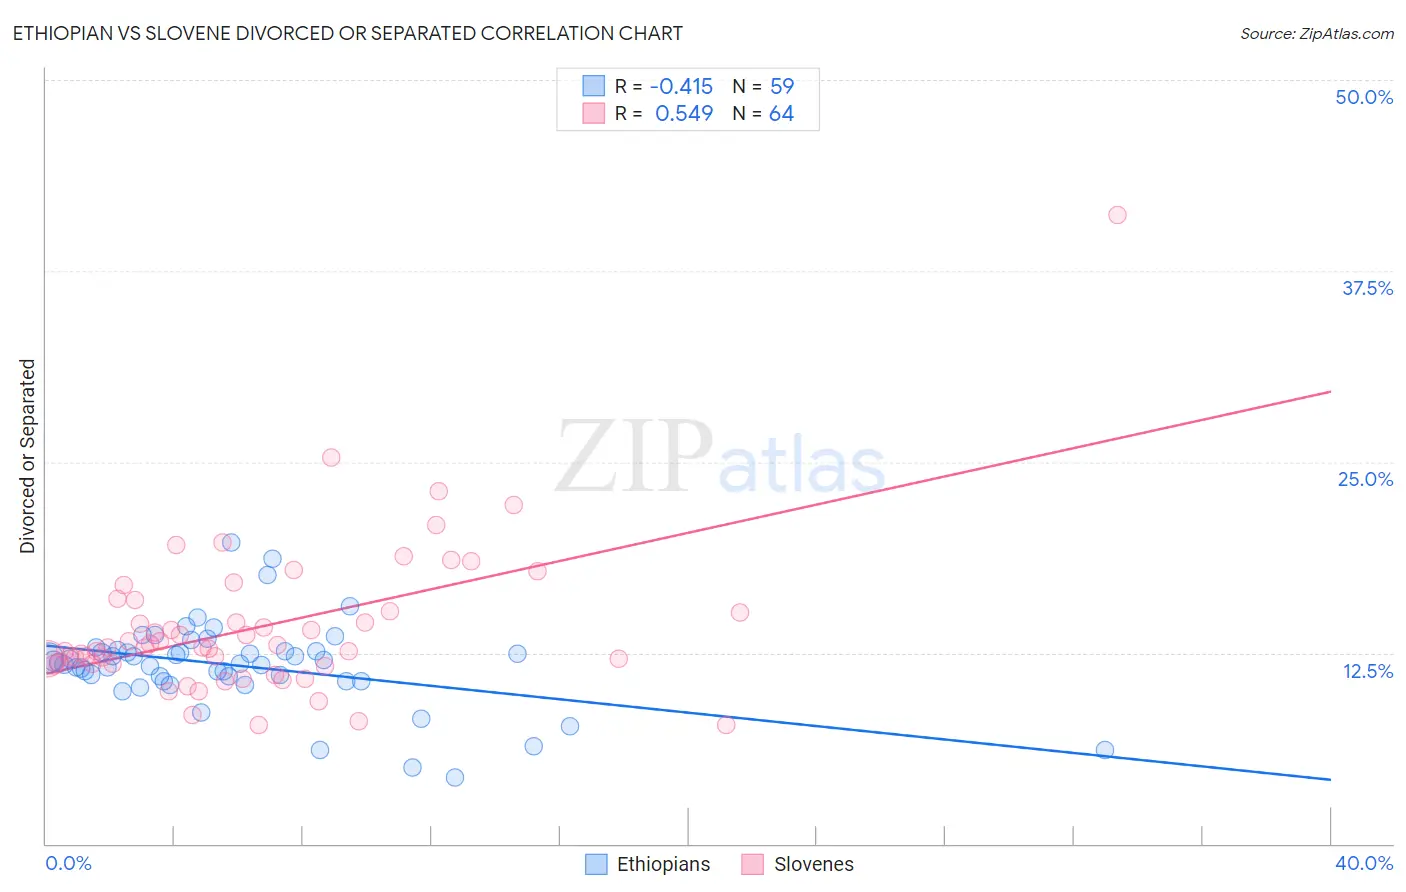
Ethiopian vs Slovene Divorced or Separated Correlation Chart
The statistical analysis conducted on geographies consisting of 223,166,328 people shows a moderate negative correlation between the proportion of Ethiopians and percentage of population currently divorced or separated in the United States with a correlation coefficient (R) of -0.415 and weighted average of 12.0%. Similarly, the statistical analysis conducted on geographies consisting of 261,286,451 people shows a substantial positive correlation between the proportion of Slovenes and percentage of population currently divorced or separated in the United States with a correlation coefficient (R) of 0.549 and weighted average of 12.3%, a difference of 1.9%.
Divorced or Separated Correlation Summary
| Measurement | Ethiopian | Slovene |
| Minimum | 4.3% | 7.7% |
| Maximum | 19.7% | 41.2% |
| Range | 15.4% | 33.5% |
| Mean | 11.7% | 14.2% |
| Median | 11.8% | 12.9% |
| Interquartile 25% (IQ1) | 10.7% | 11.8% |
| Interquartile 75% (IQ3) | 12.6% | 15.6% |
| Interquartile Range (IQR) | 1.9% | 3.8% |
| Standard Deviation (Sample) | 2.8% | 5.0% |
| Standard Deviation (Population) | 2.8% | 5.0% |
Similar Demographics by Divorced or Separated
Demographics Similar to Ethiopians by Divorced or Separated
In terms of divorced or separated, the demographic groups most similar to Ethiopians are Serbian (12.0%, a difference of 0.050%), Immigrants from Peru (12.0%, a difference of 0.050%), Tohono O'odham (12.0%, a difference of 0.070%), Mexican American Indian (12.0%, a difference of 0.10%), and German Russian (12.0%, a difference of 0.12%).
| Demographics | Rating | Rank | Divorced or Separated |
| Immigrants | Scotland | 65.8 /100 | #160 | Good 12.0% |
| Marshallese | 64.6 /100 | #161 | Good 12.0% |
| Samoans | 64.3 /100 | #162 | Good 12.0% |
| Navajo | 63.9 /100 | #163 | Good 12.0% |
| Swiss | 63.6 /100 | #164 | Good 12.0% |
| German Russians | 61.8 /100 | #165 | Good 12.0% |
| Tohono O'odham | 60.4 /100 | #166 | Good 12.0% |
| Ethiopians | 58.5 /100 | #167 | Average 12.0% |
| Serbians | 57.1 /100 | #168 | Average 12.0% |
| Immigrants | Peru | 57.0 /100 | #169 | Average 12.0% |
| Mexican American Indians | 55.8 /100 | #170 | Average 12.0% |
| Costa Ricans | 53.3 /100 | #171 | Average 12.0% |
| Immigrants | Mexico | 53.2 /100 | #172 | Average 12.0% |
| Immigrants | Moldova | 50.4 /100 | #173 | Average 12.1% |
| Hawaiians | 50.0 /100 | #174 | Average 12.1% |
Demographics Similar to Slovenes by Divorced or Separated
In terms of divorced or separated, the demographic groups most similar to Slovenes are Northern European (12.2%, a difference of 0.11%), Czechoslovakian (12.3%, a difference of 0.11%), British (12.3%, a difference of 0.12%), Immigrants from South America (12.2%, a difference of 0.15%), and Guamanian/Chamorro (12.3%, a difference of 0.15%).
| Demographics | Rating | Rank | Divorced or Separated |
| Trinidadians and Tobagonians | 16.6 /100 | #211 | Poor 12.2% |
| Immigrants | Kenya | 16.5 /100 | #212 | Poor 12.2% |
| Immigrants | Eastern Africa | 16.2 /100 | #213 | Poor 12.2% |
| Immigrants | Argentina | 15.5 /100 | #214 | Poor 12.2% |
| Europeans | 15.4 /100 | #215 | Poor 12.2% |
| Immigrants | South America | 15.4 /100 | #216 | Poor 12.2% |
| Northern Europeans | 14.7 /100 | #217 | Poor 12.2% |
| Slovenes | 13.2 /100 | #218 | Poor 12.3% |
| Czechoslovakians | 11.7 /100 | #219 | Poor 12.3% |
| British | 11.6 /100 | #220 | Poor 12.3% |
| Guamanians/Chamorros | 11.3 /100 | #221 | Poor 12.3% |
| Bangladeshis | 10.5 /100 | #222 | Poor 12.3% |
| Scandinavians | 10.4 /100 | #223 | Poor 12.3% |
| Immigrants | Azores | 9.7 /100 | #224 | Tragic 12.3% |
| Belgians | 9.7 /100 | #225 | Tragic 12.3% |