Immigrants from Denmark vs Slovene Currently Married
COMPARE
Immigrants from Denmark
Slovene
Currently Married
Currently Married Comparison
Immigrants from Denmark
Slovenes
47.6%
CURRENTLY MARRIED
90.9/ 100
METRIC RATING
113th/ 347
METRIC RANK
48.1%
CURRENTLY MARRIED
97.1/ 100
METRIC RATING
77th/ 347
METRIC RANK
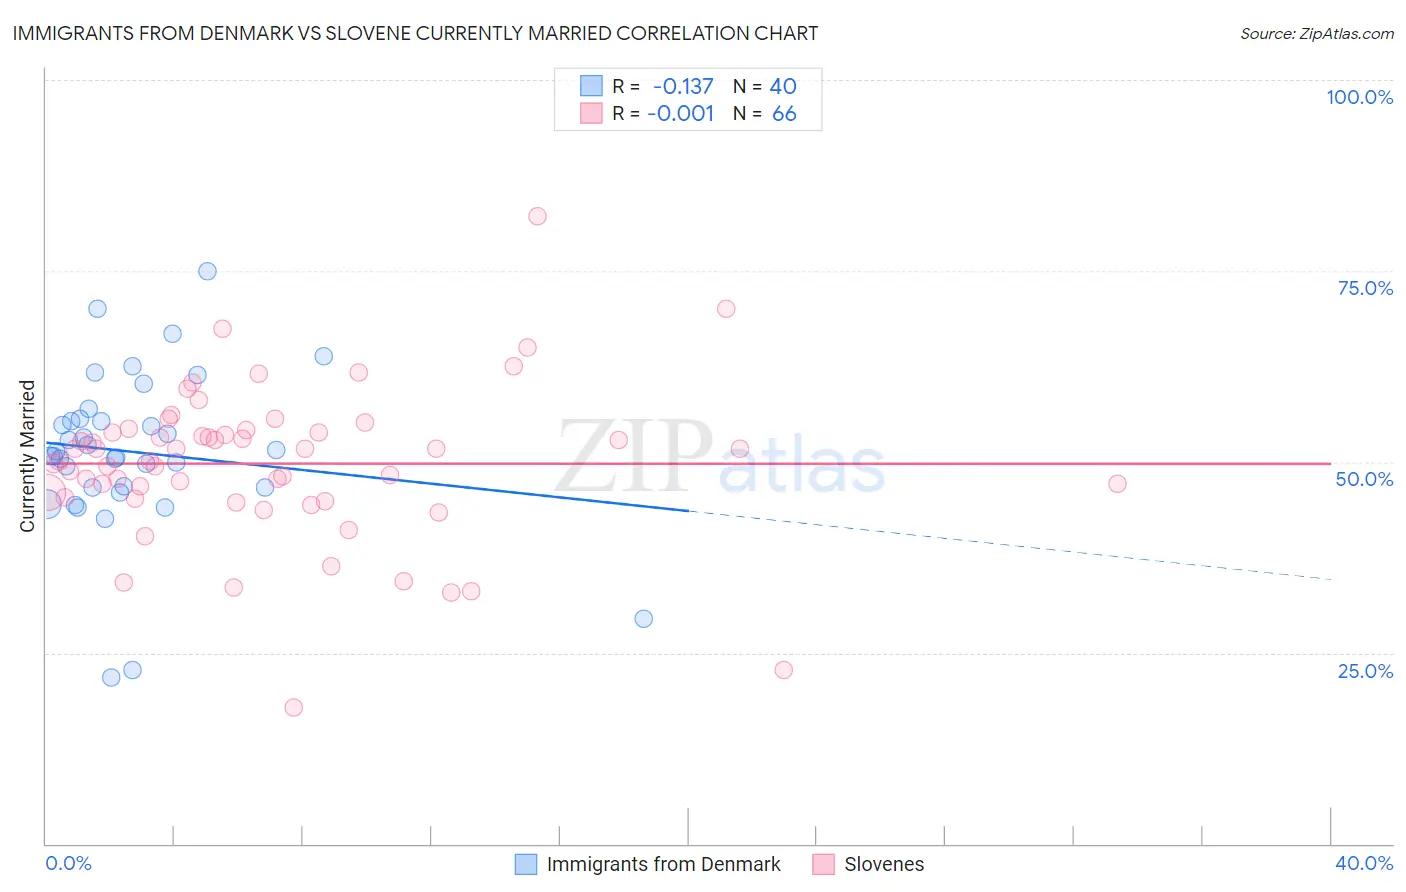
Immigrants from Denmark vs Slovene Currently Married Correlation Chart
The statistical analysis conducted on geographies consisting of 136,433,385 people shows a poor negative correlation between the proportion of Immigrants from Denmark and percentage of population currently married in the United States with a correlation coefficient (R) of -0.137 and weighted average of 47.6%. Similarly, the statistical analysis conducted on geographies consisting of 261,329,458 people shows no correlation between the proportion of Slovenes and percentage of population currently married in the United States with a correlation coefficient (R) of -0.001 and weighted average of 48.1%, a difference of 1.1%.
Currently Married Correlation Summary
| Measurement | Immigrants from Denmark | Slovene |
| Minimum | 21.8% | 17.9% |
| Maximum | 75.0% | 82.2% |
| Range | 53.2% | 64.3% |
| Mean | 51.3% | 49.8% |
| Median | 51.1% | 50.9% |
| Interquartile 25% (IQ1) | 46.6% | 45.4% |
| Interquartile 75% (IQ3) | 55.5% | 53.8% |
| Interquartile Range (IQR) | 8.9% | 8.5% |
| Standard Deviation (Sample) | 10.6% | 10.2% |
| Standard Deviation (Population) | 10.5% | 10.1% |
Similar Demographics by Currently Married
Demographics Similar to Immigrants from Denmark by Currently Married
In terms of currently married, the demographic groups most similar to Immigrants from Denmark are Immigrants from Western Europe (47.6%, a difference of 0.030%), South African (47.6%, a difference of 0.030%), Immigrants from Hungary (47.6%, a difference of 0.040%), Immigrants from Indonesia (47.6%, a difference of 0.040%), and Palestinian (47.6%, a difference of 0.050%).
| Demographics | Rating | Rank | Currently Married |
| Immigrants | Greece | 93.1 /100 | #106 | Exceptional 47.7% |
| Immigrants | Italy | 92.9 /100 | #107 | Exceptional 47.7% |
| Tsimshian | 92.4 /100 | #108 | Exceptional 47.7% |
| Immigrants | Egypt | 92.3 /100 | #109 | Exceptional 47.7% |
| Immigrants | Russia | 92.0 /100 | #110 | Exceptional 47.7% |
| Immigrants | Hungary | 91.2 /100 | #111 | Exceptional 47.6% |
| Immigrants | Western Europe | 91.1 /100 | #112 | Exceptional 47.6% |
| Immigrants | Denmark | 90.9 /100 | #113 | Exceptional 47.6% |
| South Africans | 90.5 /100 | #114 | Exceptional 47.6% |
| Immigrants | Indonesia | 90.5 /100 | #115 | Exceptional 47.6% |
| Palestinians | 90.4 /100 | #116 | Exceptional 47.6% |
| Puget Sound Salish | 90.3 /100 | #117 | Exceptional 47.6% |
| Immigrants | Philippines | 90.2 /100 | #118 | Exceptional 47.6% |
| Australians | 90.2 /100 | #119 | Exceptional 47.6% |
| Syrians | 88.9 /100 | #120 | Excellent 47.5% |
Demographics Similar to Slovenes by Currently Married
In terms of currently married, the demographic groups most similar to Slovenes are Immigrants from Belgium (48.1%, a difference of 0.010%), Basque (48.1%, a difference of 0.020%), Immigrants from South Africa (48.1%, a difference of 0.020%), Immigrants from Belarus (48.1%, a difference of 0.050%), and Immigrants from Poland (48.1%, a difference of 0.050%).
| Demographics | Rating | Rank | Currently Married |
| Immigrants | Asia | 97.9 /100 | #70 | Exceptional 48.3% |
| Macedonians | 97.9 /100 | #71 | Exceptional 48.3% |
| Immigrants | Lebanon | 97.6 /100 | #72 | Exceptional 48.2% |
| Immigrants | Eastern Asia | 97.5 /100 | #73 | Exceptional 48.2% |
| Estonians | 97.4 /100 | #74 | Exceptional 48.2% |
| Immigrants | Belarus | 97.2 /100 | #75 | Exceptional 48.1% |
| Basques | 97.2 /100 | #76 | Exceptional 48.1% |
| Slovenes | 97.1 /100 | #77 | Exceptional 48.1% |
| Immigrants | Belgium | 97.1 /100 | #78 | Exceptional 48.1% |
| Immigrants | South Africa | 97.0 /100 | #79 | Exceptional 48.1% |
| Immigrants | Poland | 96.9 /100 | #80 | Exceptional 48.1% |
| Immigrants | Sri Lanka | 96.9 /100 | #81 | Exceptional 48.1% |
| Immigrants | Europe | 96.9 /100 | #82 | Exceptional 48.1% |
| Bolivians | 96.9 /100 | #83 | Exceptional 48.1% |
| Immigrants | Israel | 96.9 /100 | #84 | Exceptional 48.1% |