Ethiopian vs Immigrants from Switzerland Average Family Size
COMPARE
Ethiopian
Immigrants from Switzerland
Average Family Size
Average Family Size Comparison
Ethiopians
Immigrants from Switzerland
3.24
AVERAGE FAMILY SIZE
63.9/ 100
METRIC RATING
159th/ 347
METRIC RANK
3.13
AVERAGE FAMILY SIZE
0.2/ 100
METRIC RATING
304th/ 347
METRIC RANK
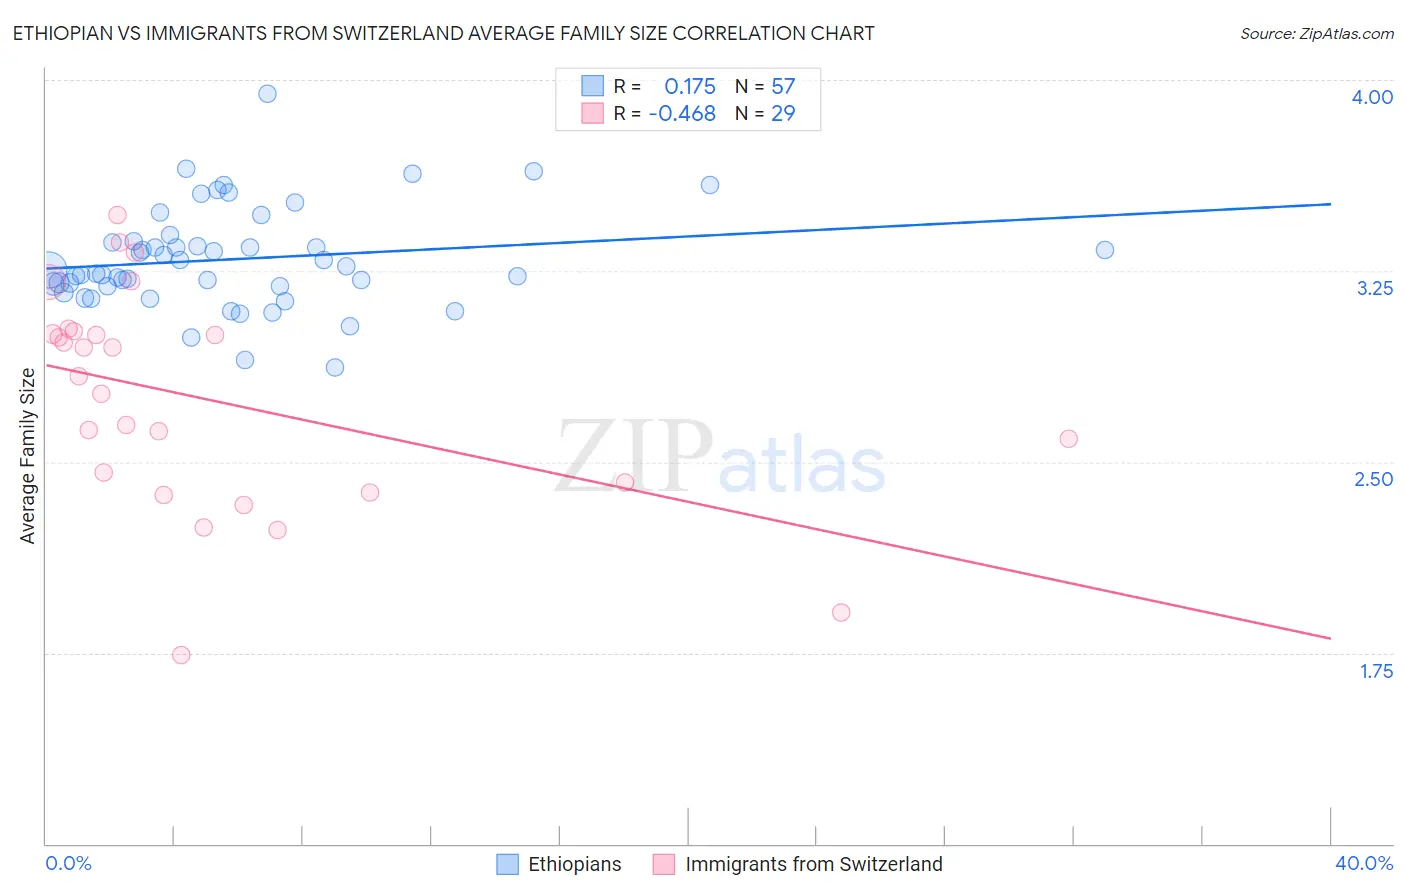
Ethiopian vs Immigrants from Switzerland Average Family Size Correlation Chart
The statistical analysis conducted on geographies consisting of 223,060,111 people shows a poor positive correlation between the proportion of Ethiopians and average family size in the United States with a correlation coefficient (R) of 0.175 and weighted average of 3.24. Similarly, the statistical analysis conducted on geographies consisting of 148,072,164 people shows a moderate negative correlation between the proportion of Immigrants from Switzerland and average family size in the United States with a correlation coefficient (R) of -0.468 and weighted average of 3.13, a difference of 3.3%.
Average Family Size Correlation Summary
| Measurement | Ethiopian | Immigrants from Switzerland |
| Minimum | 2.87 | 1.74 |
| Maximum | 3.94 | 3.47 |
| Range | 1.07 | 1.73 |
| Mean | 3.30 | 2.75 |
| Median | 3.25 | 2.84 |
| Interquartile 25% (IQ1) | 3.19 | 2.40 |
| Interquartile 75% (IQ3) | 3.36 | 3.01 |
| Interquartile Range (IQR) | 0.18 | 0.61 |
| Standard Deviation (Sample) | 0.20 | 0.43 |
| Standard Deviation (Population) | 0.20 | 0.42 |
Similar Demographics by Average Family Size
Demographics Similar to Ethiopians by Average Family Size
In terms of average family size, the demographic groups most similar to Ethiopians are Iraqi (3.24, a difference of 0.010%), Immigrants from Iraq (3.24, a difference of 0.010%), Immigrants from Chile (3.24, a difference of 0.010%), Immigrants from Uzbekistan (3.24, a difference of 0.060%), and Immigrants from Uganda (3.23, a difference of 0.070%).
| Demographics | Rating | Rank | Average Family Size |
| Spanish Americans | 72.5 /100 | #152 | Good 3.24 |
| Immigrants | Eritrea | 71.4 /100 | #153 | Good 3.24 |
| Immigrants | Egypt | 70.0 /100 | #154 | Good 3.24 |
| Seminole | 68.2 /100 | #155 | Good 3.24 |
| Immigrants | Taiwan | 68.1 /100 | #156 | Good 3.24 |
| Immigrants | Uzbekistan | 67.0 /100 | #157 | Good 3.24 |
| Iraqis | 64.3 /100 | #158 | Good 3.24 |
| Ethiopians | 63.9 /100 | #159 | Good 3.24 |
| Immigrants | Iraq | 63.7 /100 | #160 | Good 3.24 |
| Immigrants | Chile | 63.2 /100 | #161 | Good 3.24 |
| Immigrants | Uganda | 60.1 /100 | #162 | Good 3.23 |
| Uruguayans | 58.8 /100 | #163 | Average 3.23 |
| Egyptians | 58.6 /100 | #164 | Average 3.23 |
| Ugandans | 58.4 /100 | #165 | Average 3.23 |
| Immigrants | Senegal | 57.5 /100 | #166 | Average 3.23 |
Demographics Similar to Immigrants from Switzerland by Average Family Size
In terms of average family size, the demographic groups most similar to Immigrants from Switzerland are British (3.13, a difference of 0.020%), Macedonian (3.13, a difference of 0.030%), Immigrants from Latvia (3.13, a difference of 0.030%), Australian (3.13, a difference of 0.030%), and Immigrants from Ireland (3.13, a difference of 0.090%).
| Demographics | Rating | Rank | Average Family Size |
| Immigrants | Western Europe | 0.2 /100 | #297 | Tragic 3.14 |
| Colville | 0.2 /100 | #298 | Tragic 3.14 |
| Canadians | 0.2 /100 | #299 | Tragic 3.14 |
| Immigrants | Sweden | 0.2 /100 | #300 | Tragic 3.14 |
| Macedonians | 0.2 /100 | #301 | Tragic 3.13 |
| Immigrants | Latvia | 0.2 /100 | #302 | Tragic 3.13 |
| British | 0.2 /100 | #303 | Tragic 3.13 |
| Immigrants | Switzerland | 0.2 /100 | #304 | Tragic 3.13 |
| Australians | 0.1 /100 | #305 | Tragic 3.13 |
| Immigrants | Ireland | 0.1 /100 | #306 | Tragic 3.13 |
| Immigrants | Serbia | 0.1 /100 | #307 | Tragic 3.13 |
| Slavs | 0.1 /100 | #308 | Tragic 3.13 |
| Northern Europeans | 0.1 /100 | #309 | Tragic 3.13 |
| Czechoslovakians | 0.1 /100 | #310 | Tragic 3.13 |
| Immigrants | Northern Europe | 0.1 /100 | #311 | Tragic 3.13 |