Ethiopian vs Immigrants from Switzerland Disability Age 18 to 34
COMPARE
Ethiopian
Immigrants from Switzerland
Disability Age 18 to 34
Disability Age 18 to 34 Comparison
Ethiopians
Immigrants from Switzerland
6.2%
DISABILITY AGE 18 TO 34
95.8/ 100
METRIC RATING
107th/ 347
METRIC RANK
6.3%
DISABILITY AGE 18 TO 34
92.5/ 100
METRIC RATING
126th/ 347
METRIC RANK
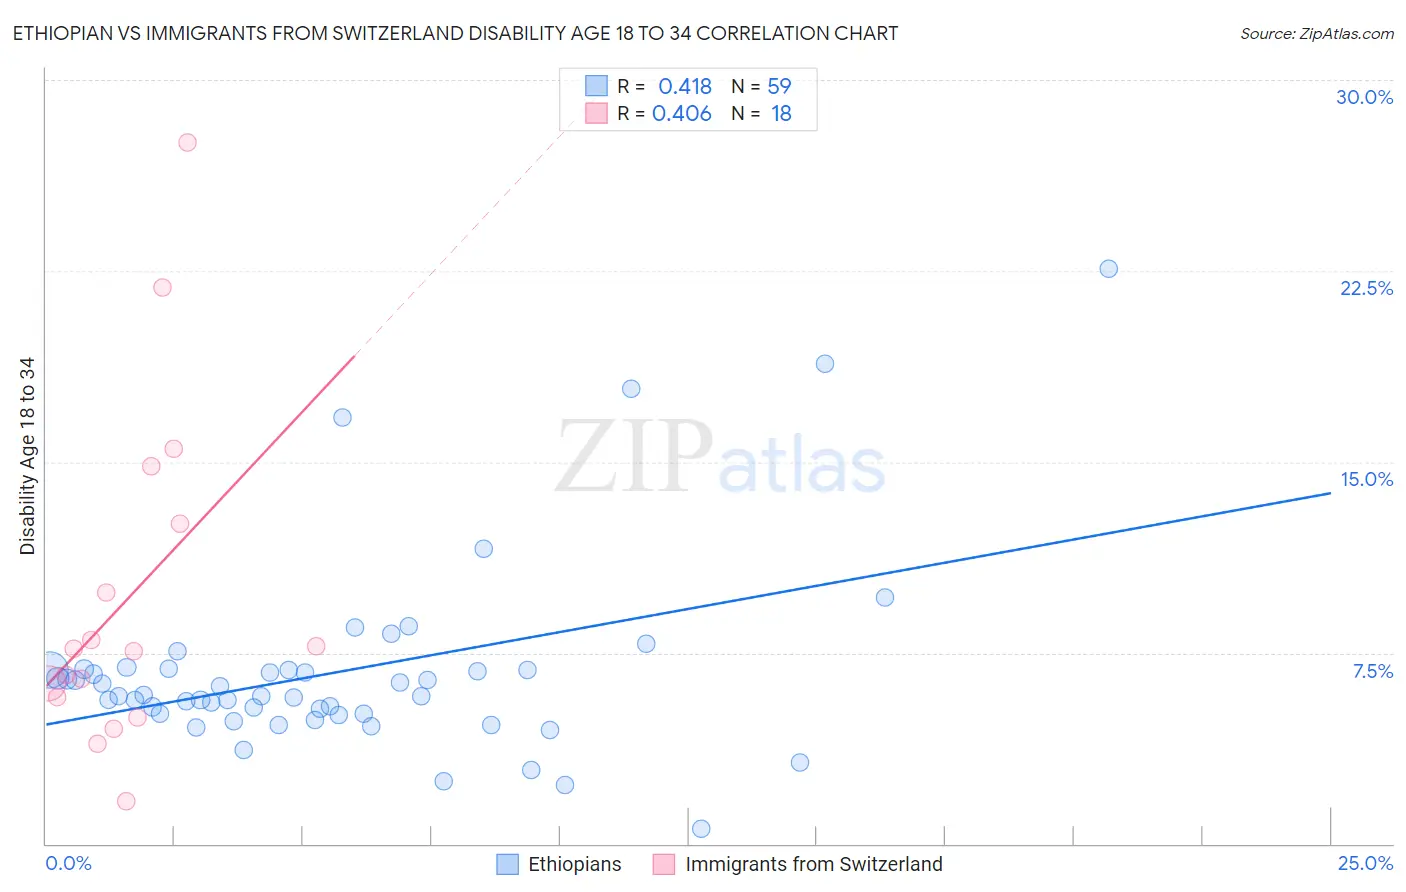
Ethiopian vs Immigrants from Switzerland Disability Age 18 to 34 Correlation Chart
The statistical analysis conducted on geographies consisting of 223,075,890 people shows a moderate positive correlation between the proportion of Ethiopians and percentage of population with a disability between the ages 18 and 35 in the United States with a correlation coefficient (R) of 0.418 and weighted average of 6.2%. Similarly, the statistical analysis conducted on geographies consisting of 147,932,555 people shows a moderate positive correlation between the proportion of Immigrants from Switzerland and percentage of population with a disability between the ages 18 and 35 in the United States with a correlation coefficient (R) of 0.406 and weighted average of 6.3%, a difference of 1.1%.
Disability Age 18 to 34 Correlation Summary
| Measurement | Ethiopian | Immigrants from Switzerland |
| Minimum | 0.58% | 1.7% |
| Maximum | 22.6% | 27.5% |
| Range | 22.0% | 25.9% |
| Mean | 6.7% | 9.6% |
| Median | 5.8% | 7.6% |
| Interquartile 25% (IQ1) | 5.1% | 5.8% |
| Interquartile 75% (IQ3) | 6.8% | 12.6% |
| Interquartile Range (IQR) | 1.7% | 6.8% |
| Standard Deviation (Sample) | 3.8% | 6.6% |
| Standard Deviation (Population) | 3.8% | 6.4% |
Demographics Similar to Ethiopians and Immigrants from Switzerland by Disability Age 18 to 34
In terms of disability age 18 to 34, the demographic groups most similar to Ethiopians are Immigrants from Croatia (6.2%, a difference of 0.040%), Immigrants from Afghanistan (6.2%, a difference of 0.050%), Sri Lankan (6.2%, a difference of 0.10%), Immigrants from Brazil (6.3%, a difference of 0.25%), and Immigrants from France (6.3%, a difference of 0.26%). Similarly, the demographic groups most similar to Immigrants from Switzerland are Macedonian (6.3%, a difference of 0.030%), Immigrants from Morocco (6.3%, a difference of 0.10%), Costa Rican (6.3%, a difference of 0.11%), Immigrants from Czechoslovakia (6.3%, a difference of 0.22%), and Immigrants from Ukraine (6.3%, a difference of 0.24%).
| Demographics | Rating | Rank | Disability Age 18 to 34 |
| Immigrants | Afghanistan | 95.9 /100 | #106 | Exceptional 6.2% |
| Ethiopians | 95.8 /100 | #107 | Exceptional 6.2% |
| Immigrants | Croatia | 95.7 /100 | #108 | Exceptional 6.2% |
| Sri Lankans | 95.5 /100 | #109 | Exceptional 6.2% |
| Immigrants | Brazil | 95.2 /100 | #110 | Exceptional 6.3% |
| Immigrants | France | 95.1 /100 | #111 | Exceptional 6.3% |
| Immigrants | Romania | 94.9 /100 | #112 | Exceptional 6.3% |
| Immigrants | Latin America | 94.9 /100 | #113 | Exceptional 6.3% |
| Immigrants | South Eastern Asia | 94.4 /100 | #114 | Exceptional 6.3% |
| Koreans | 94.1 /100 | #115 | Exceptional 6.3% |
| Immigrants | Costa Rica | 94.0 /100 | #116 | Exceptional 6.3% |
| Immigrants | Jordan | 94.0 /100 | #117 | Exceptional 6.3% |
| Immigrants | Nepal | 93.7 /100 | #118 | Exceptional 6.3% |
| Chileans | 93.5 /100 | #119 | Exceptional 6.3% |
| Immigrants | Ukraine | 93.4 /100 | #120 | Exceptional 6.3% |
| Immigrants | Guatemala | 93.4 /100 | #121 | Exceptional 6.3% |
| Immigrants | Czechoslovakia | 93.3 /100 | #122 | Exceptional 6.3% |
| Costa Ricans | 92.9 /100 | #123 | Exceptional 6.3% |
| Immigrants | Morocco | 92.9 /100 | #124 | Exceptional 6.3% |
| Macedonians | 92.6 /100 | #125 | Exceptional 6.3% |
| Immigrants | Switzerland | 92.5 /100 | #126 | Exceptional 6.3% |