Senegalese vs Immigrants from Switzerland Average Family Size
COMPARE
Senegalese
Immigrants from Switzerland
Average Family Size
Average Family Size Comparison
Senegalese
Immigrants from Switzerland
3.21
AVERAGE FAMILY SIZE
28.2/ 100
METRIC RATING
196th/ 347
METRIC RANK
3.13
AVERAGE FAMILY SIZE
0.2/ 100
METRIC RATING
304th/ 347
METRIC RANK
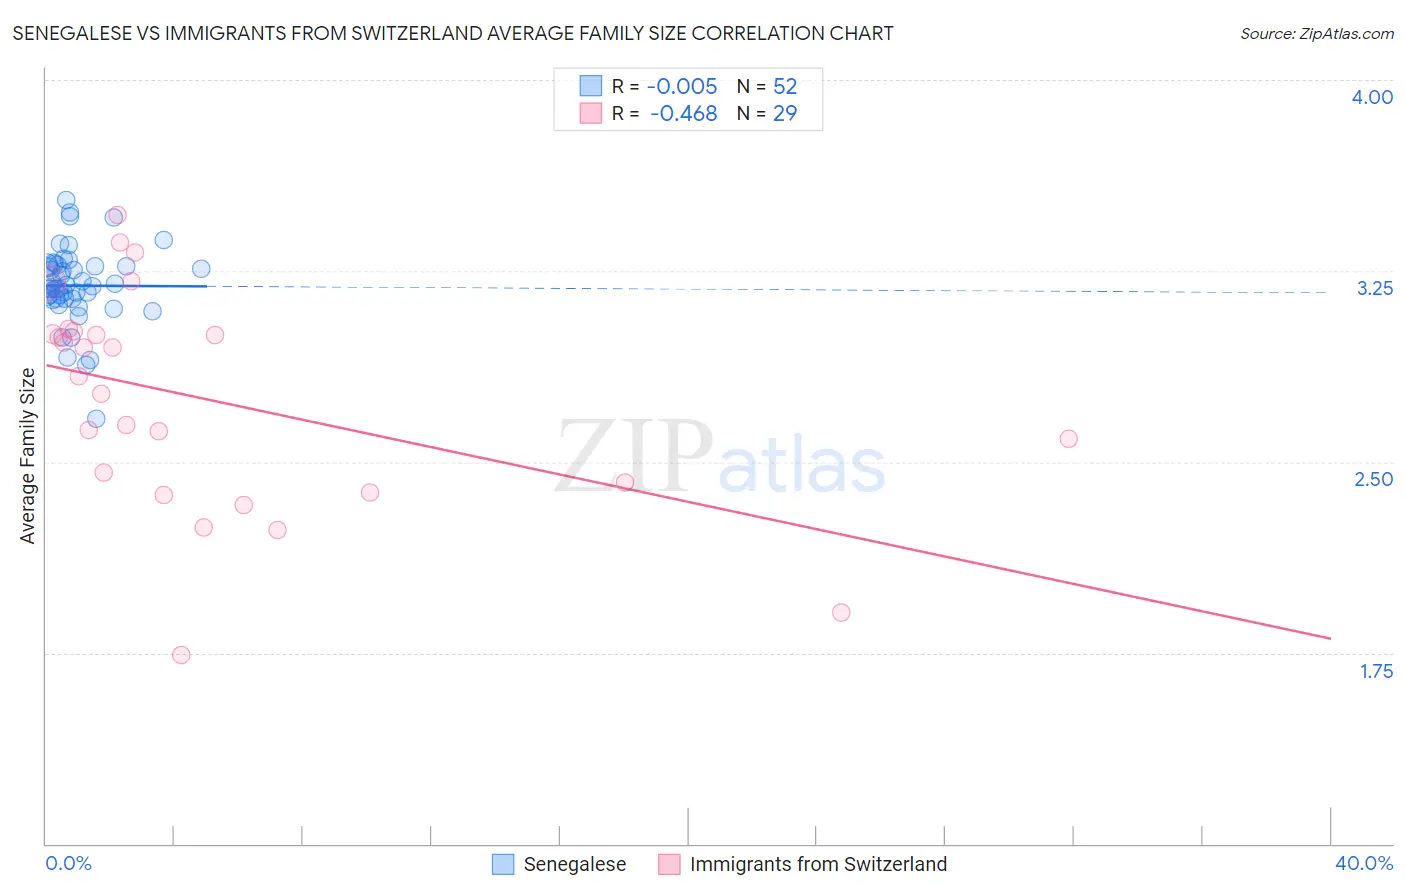
Senegalese vs Immigrants from Switzerland Average Family Size Correlation Chart
The statistical analysis conducted on geographies consisting of 78,113,781 people shows no correlation between the proportion of Senegalese and average family size in the United States with a correlation coefficient (R) of -0.005 and weighted average of 3.21. Similarly, the statistical analysis conducted on geographies consisting of 148,072,164 people shows a moderate negative correlation between the proportion of Immigrants from Switzerland and average family size in the United States with a correlation coefficient (R) of -0.468 and weighted average of 3.13, a difference of 2.6%.
Average Family Size Correlation Summary
| Measurement | Senegalese | Immigrants from Switzerland |
| Minimum | 2.67 | 1.74 |
| Maximum | 3.53 | 3.47 |
| Range | 0.86 | 1.73 |
| Mean | 3.19 | 2.75 |
| Median | 3.19 | 2.84 |
| Interquartile 25% (IQ1) | 3.14 | 2.40 |
| Interquartile 75% (IQ3) | 3.27 | 3.01 |
| Interquartile Range (IQR) | 0.13 | 0.61 |
| Standard Deviation (Sample) | 0.15 | 0.43 |
| Standard Deviation (Population) | 0.15 | 0.42 |
Similar Demographics by Average Family Size
Demographics Similar to Senegalese by Average Family Size
In terms of average family size, the demographic groups most similar to Senegalese are Choctaw (3.21, a difference of 0.0%), Kenyan (3.21, a difference of 0.0%), Immigrants from Israel (3.22, a difference of 0.020%), Immigrants from Sudan (3.22, a difference of 0.020%), and Immigrants from Eastern Africa (3.22, a difference of 0.040%).
| Demographics | Rating | Rank | Average Family Size |
| Pakistanis | 33.7 /100 | #189 | Fair 3.22 |
| Burmese | 31.0 /100 | #190 | Fair 3.22 |
| Immigrants | Zaire | 30.5 /100 | #191 | Fair 3.22 |
| Immigrants | Eastern Africa | 30.1 /100 | #192 | Fair 3.22 |
| Immigrants | Israel | 29.3 /100 | #193 | Fair 3.22 |
| Immigrants | Sudan | 29.1 /100 | #194 | Fair 3.22 |
| Choctaw | 28.3 /100 | #195 | Fair 3.21 |
| Senegalese | 28.2 /100 | #196 | Fair 3.21 |
| Kenyans | 28.0 /100 | #197 | Fair 3.21 |
| Immigrants | Azores | 21.7 /100 | #198 | Fair 3.21 |
| Hmong | 20.7 /100 | #199 | Fair 3.21 |
| Immigrants | Kenya | 19.2 /100 | #200 | Poor 3.21 |
| Immigrants | Morocco | 18.5 /100 | #201 | Poor 3.21 |
| Immigrants | India | 18.5 /100 | #202 | Poor 3.21 |
| Immigrants | Nepal | 18.1 /100 | #203 | Poor 3.21 |
Demographics Similar to Immigrants from Switzerland by Average Family Size
In terms of average family size, the demographic groups most similar to Immigrants from Switzerland are British (3.13, a difference of 0.020%), Macedonian (3.13, a difference of 0.030%), Immigrants from Latvia (3.13, a difference of 0.030%), Australian (3.13, a difference of 0.030%), and Immigrants from Ireland (3.13, a difference of 0.090%).
| Demographics | Rating | Rank | Average Family Size |
| Immigrants | Western Europe | 0.2 /100 | #297 | Tragic 3.14 |
| Colville | 0.2 /100 | #298 | Tragic 3.14 |
| Canadians | 0.2 /100 | #299 | Tragic 3.14 |
| Immigrants | Sweden | 0.2 /100 | #300 | Tragic 3.14 |
| Macedonians | 0.2 /100 | #301 | Tragic 3.13 |
| Immigrants | Latvia | 0.2 /100 | #302 | Tragic 3.13 |
| British | 0.2 /100 | #303 | Tragic 3.13 |
| Immigrants | Switzerland | 0.2 /100 | #304 | Tragic 3.13 |
| Australians | 0.1 /100 | #305 | Tragic 3.13 |
| Immigrants | Ireland | 0.1 /100 | #306 | Tragic 3.13 |
| Immigrants | Serbia | 0.1 /100 | #307 | Tragic 3.13 |
| Slavs | 0.1 /100 | #308 | Tragic 3.13 |
| Northern Europeans | 0.1 /100 | #309 | Tragic 3.13 |
| Czechoslovakians | 0.1 /100 | #310 | Tragic 3.13 |
| Immigrants | Northern Europe | 0.1 /100 | #311 | Tragic 3.13 |