Ethiopian vs Bolivian Average Family Size
COMPARE
Ethiopian
Bolivian
Average Family Size
Average Family Size Comparison
Ethiopians
Bolivians
3.24
AVERAGE FAMILY SIZE
63.9/ 100
METRIC RATING
159th/ 347
METRIC RANK
3.29
AVERAGE FAMILY SIZE
98.3/ 100
METRIC RATING
104th/ 347
METRIC RANK
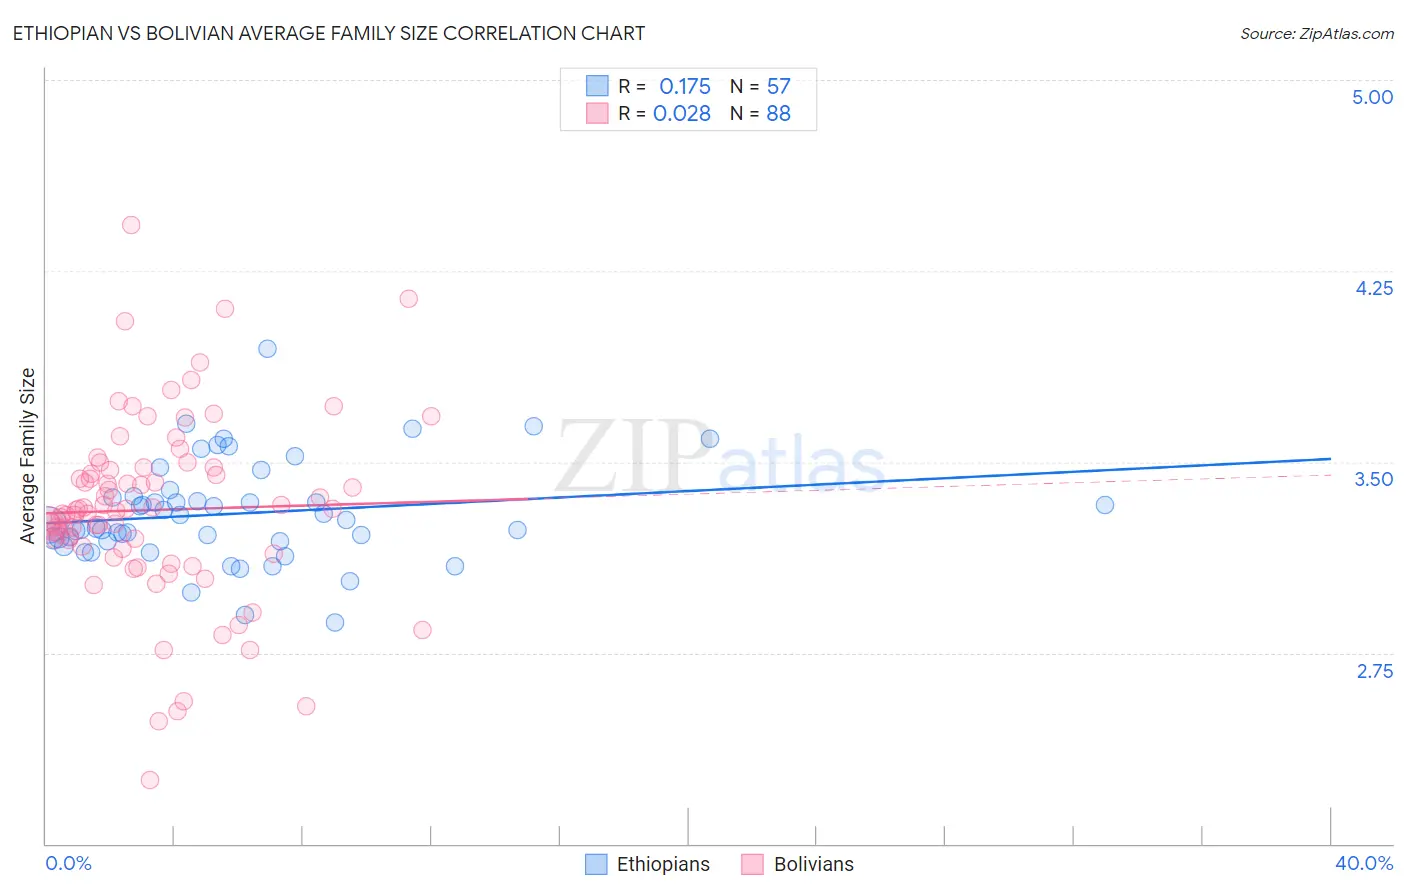
Ethiopian vs Bolivian Average Family Size Correlation Chart
The statistical analysis conducted on geographies consisting of 223,060,111 people shows a poor positive correlation between the proportion of Ethiopians and average family size in the United States with a correlation coefficient (R) of 0.175 and weighted average of 3.24. Similarly, the statistical analysis conducted on geographies consisting of 184,628,793 people shows no correlation between the proportion of Bolivians and average family size in the United States with a correlation coefficient (R) of 0.028 and weighted average of 3.29, a difference of 1.6%.
Average Family Size Correlation Summary
| Measurement | Ethiopian | Bolivian |
| Minimum | 2.87 | 2.25 |
| Maximum | 3.94 | 4.43 |
| Range | 1.07 | 2.18 |
| Mean | 3.30 | 3.31 |
| Median | 3.25 | 3.31 |
| Interquartile 25% (IQ1) | 3.19 | 3.16 |
| Interquartile 75% (IQ3) | 3.36 | 3.47 |
| Interquartile Range (IQR) | 0.18 | 0.31 |
| Standard Deviation (Sample) | 0.20 | 0.36 |
| Standard Deviation (Population) | 0.20 | 0.36 |
Similar Demographics by Average Family Size
Demographics Similar to Ethiopians by Average Family Size
In terms of average family size, the demographic groups most similar to Ethiopians are Iraqi (3.24, a difference of 0.010%), Immigrants from Iraq (3.24, a difference of 0.010%), Immigrants from Chile (3.24, a difference of 0.010%), Immigrants from Uzbekistan (3.24, a difference of 0.060%), and Immigrants from Uganda (3.23, a difference of 0.070%).
| Demographics | Rating | Rank | Average Family Size |
| Spanish Americans | 72.5 /100 | #152 | Good 3.24 |
| Immigrants | Eritrea | 71.4 /100 | #153 | Good 3.24 |
| Immigrants | Egypt | 70.0 /100 | #154 | Good 3.24 |
| Seminole | 68.2 /100 | #155 | Good 3.24 |
| Immigrants | Taiwan | 68.1 /100 | #156 | Good 3.24 |
| Immigrants | Uzbekistan | 67.0 /100 | #157 | Good 3.24 |
| Iraqis | 64.3 /100 | #158 | Good 3.24 |
| Ethiopians | 63.9 /100 | #159 | Good 3.24 |
| Immigrants | Iraq | 63.7 /100 | #160 | Good 3.24 |
| Immigrants | Chile | 63.2 /100 | #161 | Good 3.24 |
| Immigrants | Uganda | 60.1 /100 | #162 | Good 3.23 |
| Uruguayans | 58.8 /100 | #163 | Average 3.23 |
| Egyptians | 58.6 /100 | #164 | Average 3.23 |
| Ugandans | 58.4 /100 | #165 | Average 3.23 |
| Immigrants | Senegal | 57.5 /100 | #166 | Average 3.23 |
Demographics Similar to Bolivians by Average Family Size
In terms of average family size, the demographic groups most similar to Bolivians are Immigrants from Western Africa (3.29, a difference of 0.040%), Immigrants from Ghana (3.29, a difference of 0.050%), Immigrants from Burma/Myanmar (3.29, a difference of 0.070%), West Indian (3.29, a difference of 0.070%), and Paiute (3.29, a difference of 0.070%).
| Demographics | Rating | Rank | Average Family Size |
| Immigrants | Oceania | 98.7 /100 | #97 | Exceptional 3.29 |
| Barbadians | 98.6 /100 | #98 | Exceptional 3.29 |
| Nigerians | 98.6 /100 | #99 | Exceptional 3.29 |
| Guamanians/Chamorros | 98.6 /100 | #100 | Exceptional 3.29 |
| Immigrants | Burma/Myanmar | 98.6 /100 | #101 | Exceptional 3.29 |
| West Indians | 98.5 /100 | #102 | Exceptional 3.29 |
| Immigrants | Western Africa | 98.4 /100 | #103 | Exceptional 3.29 |
| Bolivians | 98.3 /100 | #104 | Exceptional 3.29 |
| Immigrants | Ghana | 98.1 /100 | #105 | Exceptional 3.29 |
| Paiute | 98.0 /100 | #106 | Exceptional 3.29 |
| Ghanaians | 98.0 /100 | #107 | Exceptional 3.29 |
| Asians | 97.0 /100 | #108 | Exceptional 3.28 |
| Puerto Ricans | 96.7 /100 | #109 | Exceptional 3.28 |
| Bahamians | 96.6 /100 | #110 | Exceptional 3.28 |
| Indonesians | 96.2 /100 | #111 | Exceptional 3.28 |