Ethiopian vs Kiowa Average Family Size
COMPARE
Ethiopian
Kiowa
Average Family Size
Average Family Size Comparison
Ethiopians
Kiowa
3.24
AVERAGE FAMILY SIZE
63.9/ 100
METRIC RATING
159th/ 347
METRIC RANK
3.27
AVERAGE FAMILY SIZE
94.8/ 100
METRIC RATING
117th/ 347
METRIC RANK
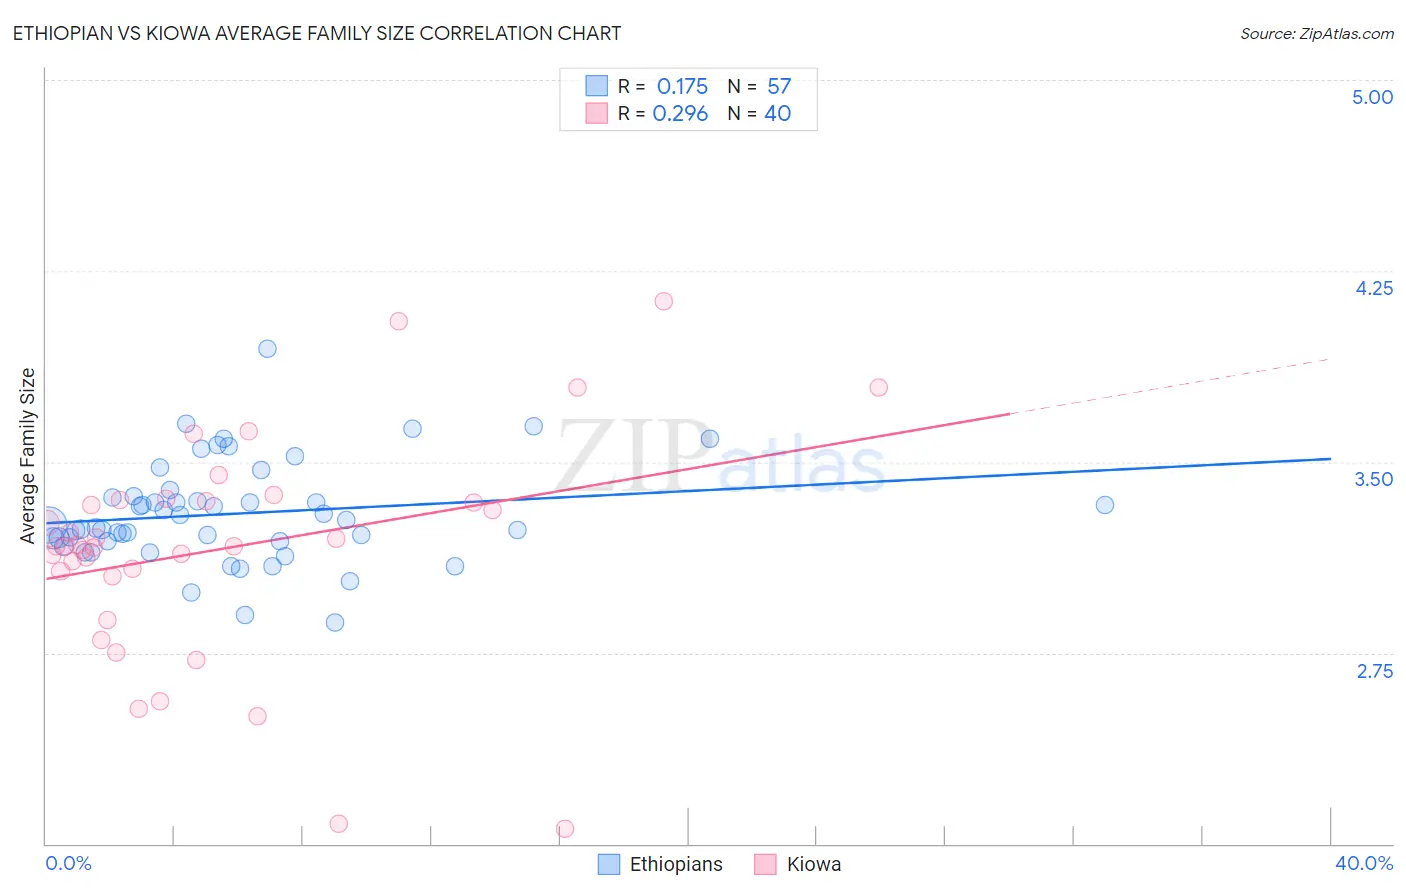
Ethiopian vs Kiowa Average Family Size Correlation Chart
The statistical analysis conducted on geographies consisting of 223,060,111 people shows a poor positive correlation between the proportion of Ethiopians and average family size in the United States with a correlation coefficient (R) of 0.175 and weighted average of 3.24. Similarly, the statistical analysis conducted on geographies consisting of 56,098,854 people shows a weak positive correlation between the proportion of Kiowa and average family size in the United States with a correlation coefficient (R) of 0.296 and weighted average of 3.27, a difference of 1.1%.
Average Family Size Correlation Summary
| Measurement | Ethiopian | Kiowa |
| Minimum | 2.87 | 2.06 |
| Maximum | 3.94 | 4.13 |
| Range | 1.07 | 2.07 |
| Mean | 3.30 | 3.16 |
| Median | 3.25 | 3.17 |
| Interquartile 25% (IQ1) | 3.19 | 3.06 |
| Interquartile 75% (IQ3) | 3.36 | 3.35 |
| Interquartile Range (IQR) | 0.18 | 0.29 |
| Standard Deviation (Sample) | 0.20 | 0.44 |
| Standard Deviation (Population) | 0.20 | 0.43 |
Similar Demographics by Average Family Size
Demographics Similar to Ethiopians by Average Family Size
In terms of average family size, the demographic groups most similar to Ethiopians are Iraqi (3.24, a difference of 0.010%), Immigrants from Iraq (3.24, a difference of 0.010%), Immigrants from Chile (3.24, a difference of 0.010%), Immigrants from Uzbekistan (3.24, a difference of 0.060%), and Immigrants from Uganda (3.23, a difference of 0.070%).
| Demographics | Rating | Rank | Average Family Size |
| Spanish Americans | 72.5 /100 | #152 | Good 3.24 |
| Immigrants | Eritrea | 71.4 /100 | #153 | Good 3.24 |
| Immigrants | Egypt | 70.0 /100 | #154 | Good 3.24 |
| Seminole | 68.2 /100 | #155 | Good 3.24 |
| Immigrants | Taiwan | 68.1 /100 | #156 | Good 3.24 |
| Immigrants | Uzbekistan | 67.0 /100 | #157 | Good 3.24 |
| Iraqis | 64.3 /100 | #158 | Good 3.24 |
| Ethiopians | 63.9 /100 | #159 | Good 3.24 |
| Immigrants | Iraq | 63.7 /100 | #160 | Good 3.24 |
| Immigrants | Chile | 63.2 /100 | #161 | Good 3.24 |
| Immigrants | Uganda | 60.1 /100 | #162 | Good 3.23 |
| Uruguayans | 58.8 /100 | #163 | Average 3.23 |
| Egyptians | 58.6 /100 | #164 | Average 3.23 |
| Ugandans | 58.4 /100 | #165 | Average 3.23 |
| Immigrants | Senegal | 57.5 /100 | #166 | Average 3.23 |
Demographics Similar to Kiowa by Average Family Size
In terms of average family size, the demographic groups most similar to Kiowa are Immigrants from Liberia (3.27, a difference of 0.020%), Immigrants from South America (3.27, a difference of 0.020%), South American (3.27, a difference of 0.030%), Immigrants from Asia (3.27, a difference of 0.070%), and Immigrants from Panama (3.27, a difference of 0.080%).
| Demographics | Rating | Rank | Average Family Size |
| Bahamians | 96.6 /100 | #110 | Exceptional 3.28 |
| Indonesians | 96.2 /100 | #111 | Exceptional 3.28 |
| Blacks/African Americans | 95.7 /100 | #112 | Exceptional 3.27 |
| Immigrants | Panama | 95.6 /100 | #113 | Exceptional 3.27 |
| South Americans | 95.1 /100 | #114 | Exceptional 3.27 |
| Immigrants | Liberia | 95.0 /100 | #115 | Exceptional 3.27 |
| Immigrants | South America | 95.0 /100 | #116 | Exceptional 3.27 |
| Kiowa | 94.8 /100 | #117 | Exceptional 3.27 |
| Immigrants | Asia | 94.0 /100 | #118 | Exceptional 3.27 |
| Immigrants | Indonesia | 93.7 /100 | #119 | Exceptional 3.27 |
| Immigrants | Bahamas | 93.6 /100 | #120 | Exceptional 3.27 |
| Immigrants | Thailand | 93.3 /100 | #121 | Exceptional 3.27 |
| Immigrants | Colombia | 92.8 /100 | #122 | Exceptional 3.27 |
| Alaskan Athabascans | 92.4 /100 | #123 | Exceptional 3.27 |
| South American Indians | 91.6 /100 | #124 | Exceptional 3.26 |