Ethiopian vs Thai Average Family Size
COMPARE
Ethiopian
Thai
Average Family Size
Average Family Size Comparison
Ethiopians
Thais
3.24
AVERAGE FAMILY SIZE
63.9/ 100
METRIC RATING
159th/ 347
METRIC RANK
3.22
AVERAGE FAMILY SIZE
38.3/ 100
METRIC RATING
188th/ 347
METRIC RANK
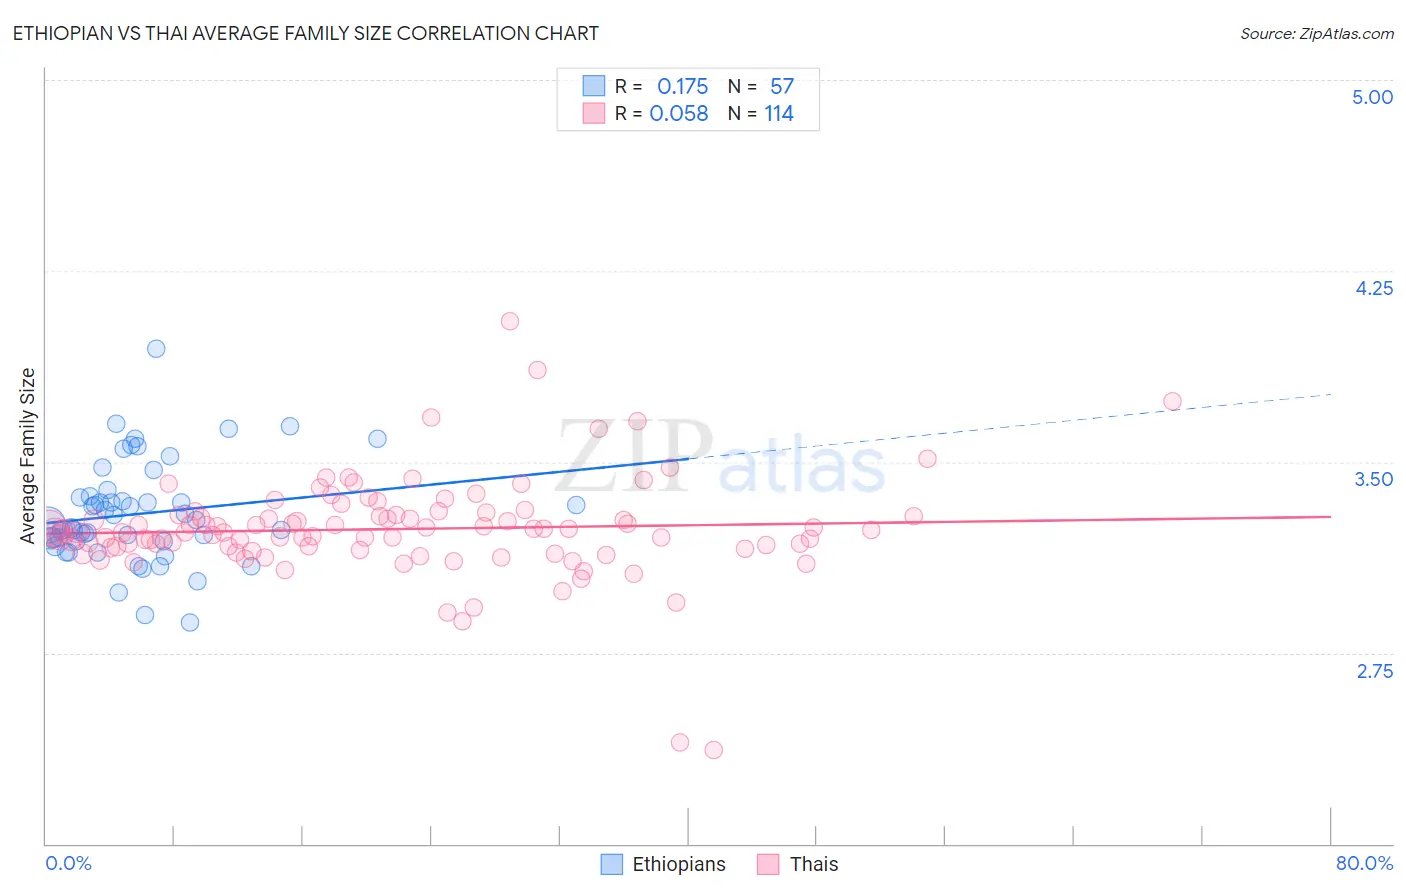
Ethiopian vs Thai Average Family Size Correlation Chart
The statistical analysis conducted on geographies consisting of 223,060,111 people shows a poor positive correlation between the proportion of Ethiopians and average family size in the United States with a correlation coefficient (R) of 0.175 and weighted average of 3.24. Similarly, the statistical analysis conducted on geographies consisting of 475,374,663 people shows a slight positive correlation between the proportion of Thais and average family size in the United States with a correlation coefficient (R) of 0.058 and weighted average of 3.22, a difference of 0.48%.
Average Family Size Correlation Summary
| Measurement | Ethiopian | Thai |
| Minimum | 2.87 | 2.37 |
| Maximum | 3.94 | 4.05 |
| Range | 1.07 | 1.68 |
| Mean | 3.30 | 3.24 |
| Median | 3.25 | 3.22 |
| Interquartile 25% (IQ1) | 3.19 | 3.16 |
| Interquartile 75% (IQ3) | 3.36 | 3.29 |
| Interquartile Range (IQR) | 0.18 | 0.13 |
| Standard Deviation (Sample) | 0.20 | 0.20 |
| Standard Deviation (Population) | 0.20 | 0.20 |
Similar Demographics by Average Family Size
Demographics Similar to Ethiopians by Average Family Size
In terms of average family size, the demographic groups most similar to Ethiopians are Iraqi (3.24, a difference of 0.010%), Immigrants from Iraq (3.24, a difference of 0.010%), Immigrants from Chile (3.24, a difference of 0.010%), Immigrants from Uzbekistan (3.24, a difference of 0.060%), and Immigrants from Uganda (3.23, a difference of 0.070%).
| Demographics | Rating | Rank | Average Family Size |
| Spanish Americans | 72.5 /100 | #152 | Good 3.24 |
| Immigrants | Eritrea | 71.4 /100 | #153 | Good 3.24 |
| Immigrants | Egypt | 70.0 /100 | #154 | Good 3.24 |
| Seminole | 68.2 /100 | #155 | Good 3.24 |
| Immigrants | Taiwan | 68.1 /100 | #156 | Good 3.24 |
| Immigrants | Uzbekistan | 67.0 /100 | #157 | Good 3.24 |
| Iraqis | 64.3 /100 | #158 | Good 3.24 |
| Ethiopians | 63.9 /100 | #159 | Good 3.24 |
| Immigrants | Iraq | 63.7 /100 | #160 | Good 3.24 |
| Immigrants | Chile | 63.2 /100 | #161 | Good 3.24 |
| Immigrants | Uganda | 60.1 /100 | #162 | Good 3.23 |
| Uruguayans | 58.8 /100 | #163 | Average 3.23 |
| Egyptians | 58.6 /100 | #164 | Average 3.23 |
| Ugandans | 58.4 /100 | #165 | Average 3.23 |
| Immigrants | Senegal | 57.5 /100 | #166 | Average 3.23 |
Demographics Similar to Thais by Average Family Size
In terms of average family size, the demographic groups most similar to Thais are Immigrants from Malaysia (3.22, a difference of 0.010%), Immigrants from Sri Lanka (3.22, a difference of 0.030%), Immigrants from Argentina (3.22, a difference of 0.030%), Immigrants from Eastern Asia (3.22, a difference of 0.050%), and Immigrants from Northern Africa (3.22, a difference of 0.070%).
| Demographics | Rating | Rank | Average Family Size |
| Spanish | 44.8 /100 | #181 | Average 3.23 |
| Moroccans | 44.2 /100 | #182 | Average 3.22 |
| Immigrants | Northern Africa | 41.7 /100 | #183 | Average 3.22 |
| Immigrants | Eastern Asia | 40.8 /100 | #184 | Average 3.22 |
| Immigrants | Sri Lanka | 39.8 /100 | #185 | Fair 3.22 |
| Immigrants | Argentina | 39.8 /100 | #186 | Fair 3.22 |
| Immigrants | Malaysia | 39.0 /100 | #187 | Fair 3.22 |
| Thais | 38.3 /100 | #188 | Fair 3.22 |
| Pakistanis | 33.7 /100 | #189 | Fair 3.22 |
| Burmese | 31.0 /100 | #190 | Fair 3.22 |
| Immigrants | Zaire | 30.5 /100 | #191 | Fair 3.22 |
| Immigrants | Eastern Africa | 30.1 /100 | #192 | Fair 3.22 |
| Immigrants | Israel | 29.3 /100 | #193 | Fair 3.22 |
| Immigrants | Sudan | 29.1 /100 | #194 | Fair 3.22 |
| Choctaw | 28.3 /100 | #195 | Fair 3.21 |