Ethiopian vs Immigrants from Fiji Average Family Size
COMPARE
Ethiopian
Immigrants from Fiji
Average Family Size
Average Family Size Comparison
Ethiopians
Immigrants from Fiji
3.24
AVERAGE FAMILY SIZE
63.9/ 100
METRIC RATING
159th/ 347
METRIC RANK
3.45
AVERAGE FAMILY SIZE
100.0/ 100
METRIC RATING
23rd/ 347
METRIC RANK
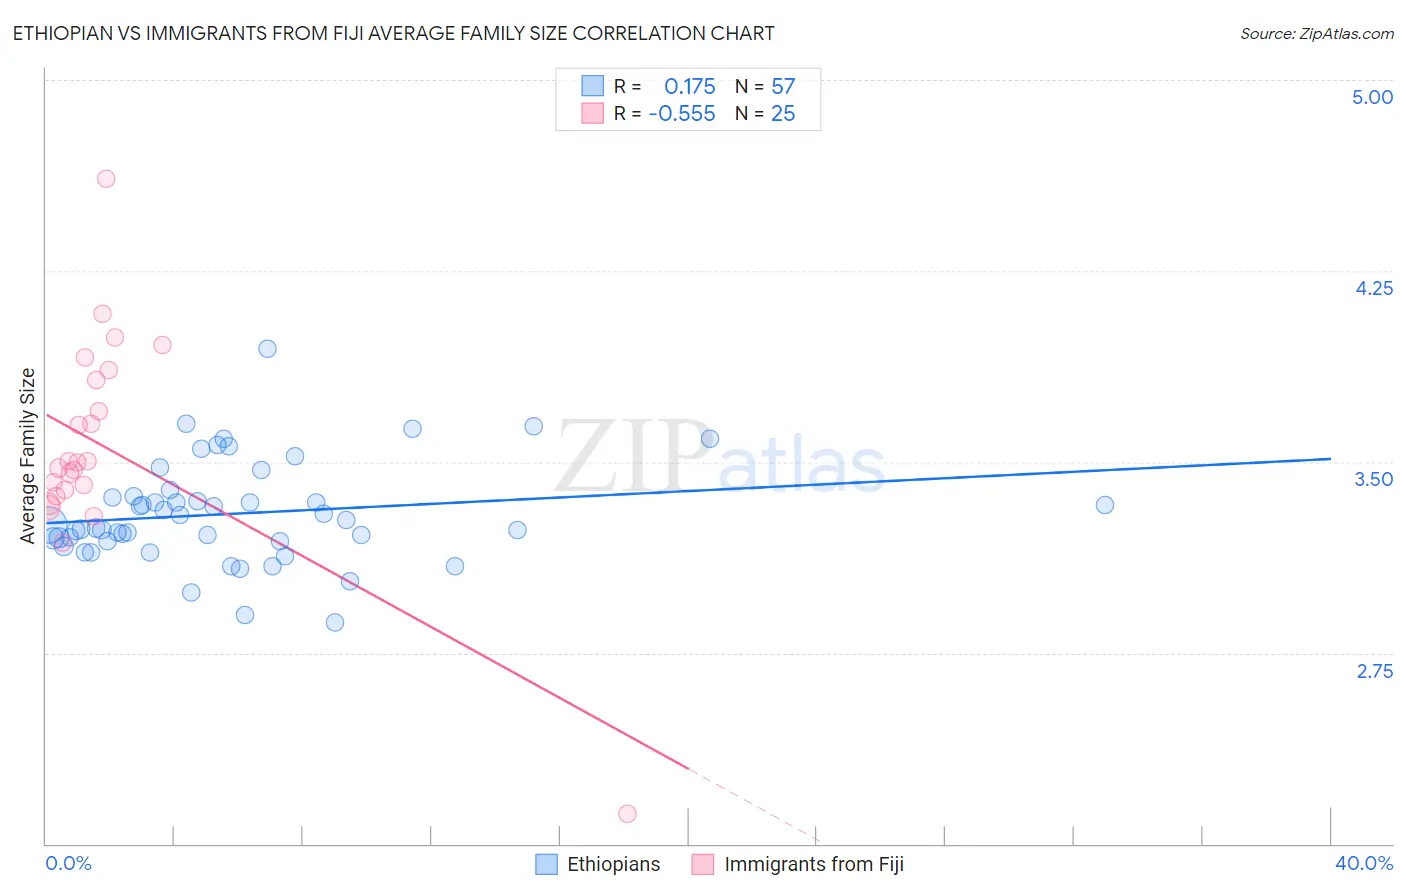
Ethiopian vs Immigrants from Fiji Average Family Size Correlation Chart
The statistical analysis conducted on geographies consisting of 223,060,111 people shows a poor positive correlation between the proportion of Ethiopians and average family size in the United States with a correlation coefficient (R) of 0.175 and weighted average of 3.24. Similarly, the statistical analysis conducted on geographies consisting of 93,754,900 people shows a substantial negative correlation between the proportion of Immigrants from Fiji and average family size in the United States with a correlation coefficient (R) of -0.555 and weighted average of 3.45, a difference of 6.7%.
Average Family Size Correlation Summary
| Measurement | Ethiopian | Immigrants from Fiji |
| Minimum | 2.87 | 2.12 |
| Maximum | 3.94 | 4.61 |
| Range | 1.07 | 2.49 |
| Mean | 3.30 | 3.56 |
| Median | 3.25 | 3.50 |
| Interquartile 25% (IQ1) | 3.19 | 3.38 |
| Interquartile 75% (IQ3) | 3.36 | 3.84 |
| Interquartile Range (IQR) | 0.18 | 0.46 |
| Standard Deviation (Sample) | 0.20 | 0.44 |
| Standard Deviation (Population) | 0.20 | 0.43 |
Similar Demographics by Average Family Size
Demographics Similar to Ethiopians by Average Family Size
In terms of average family size, the demographic groups most similar to Ethiopians are Iraqi (3.24, a difference of 0.010%), Immigrants from Iraq (3.24, a difference of 0.010%), Immigrants from Chile (3.24, a difference of 0.010%), Immigrants from Uzbekistan (3.24, a difference of 0.060%), and Immigrants from Uganda (3.23, a difference of 0.070%).
| Demographics | Rating | Rank | Average Family Size |
| Spanish Americans | 72.5 /100 | #152 | Good 3.24 |
| Immigrants | Eritrea | 71.4 /100 | #153 | Good 3.24 |
| Immigrants | Egypt | 70.0 /100 | #154 | Good 3.24 |
| Seminole | 68.2 /100 | #155 | Good 3.24 |
| Immigrants | Taiwan | 68.1 /100 | #156 | Good 3.24 |
| Immigrants | Uzbekistan | 67.0 /100 | #157 | Good 3.24 |
| Iraqis | 64.3 /100 | #158 | Good 3.24 |
| Ethiopians | 63.9 /100 | #159 | Good 3.24 |
| Immigrants | Iraq | 63.7 /100 | #160 | Good 3.24 |
| Immigrants | Chile | 63.2 /100 | #161 | Good 3.24 |
| Immigrants | Uganda | 60.1 /100 | #162 | Good 3.23 |
| Uruguayans | 58.8 /100 | #163 | Average 3.23 |
| Egyptians | 58.6 /100 | #164 | Average 3.23 |
| Ugandans | 58.4 /100 | #165 | Average 3.23 |
| Immigrants | Senegal | 57.5 /100 | #166 | Average 3.23 |
Demographics Similar to Immigrants from Fiji by Average Family Size
In terms of average family size, the demographic groups most similar to Immigrants from Fiji are Native/Alaskan (3.45, a difference of 0.12%), Yakama (3.45, a difference of 0.23%), Apache (3.46, a difference of 0.29%), Yuman (3.47, a difference of 0.35%), and Cheyenne (3.47, a difference of 0.60%).
| Demographics | Rating | Rank | Average Family Size |
| Ute | 100.0 /100 | #16 | Exceptional 3.49 |
| Immigrants | El Salvador | 100.0 /100 | #17 | Exceptional 3.49 |
| Salvadorans | 100.0 /100 | #18 | Exceptional 3.48 |
| Mexicans | 100.0 /100 | #19 | Exceptional 3.48 |
| Cheyenne | 100.0 /100 | #20 | Exceptional 3.47 |
| Yuman | 100.0 /100 | #21 | Exceptional 3.47 |
| Apache | 100.0 /100 | #22 | Exceptional 3.46 |
| Immigrants | Fiji | 100.0 /100 | #23 | Exceptional 3.45 |
| Natives/Alaskans | 100.0 /100 | #24 | Exceptional 3.45 |
| Yakama | 100.0 /100 | #25 | Exceptional 3.45 |
| Native Hawaiians | 100.0 /100 | #26 | Exceptional 3.43 |
| Mexican American Indians | 100.0 /100 | #27 | Exceptional 3.43 |
| Immigrants | Latin America | 100.0 /100 | #28 | Exceptional 3.42 |
| Nepalese | 100.0 /100 | #29 | Exceptional 3.42 |
| Samoans | 100.0 /100 | #30 | Exceptional 3.42 |