Immigrants from Dominica vs Immigrants from Switzerland Average Family Size
COMPARE
Immigrants from Dominica
Immigrants from Switzerland
Average Family Size
Average Family Size Comparison
Immigrants from Dominica
Immigrants from Switzerland
3.32
AVERAGE FAMILY SIZE
99.8/ 100
METRIC RATING
81st/ 347
METRIC RANK
3.13
AVERAGE FAMILY SIZE
0.2/ 100
METRIC RATING
304th/ 347
METRIC RANK
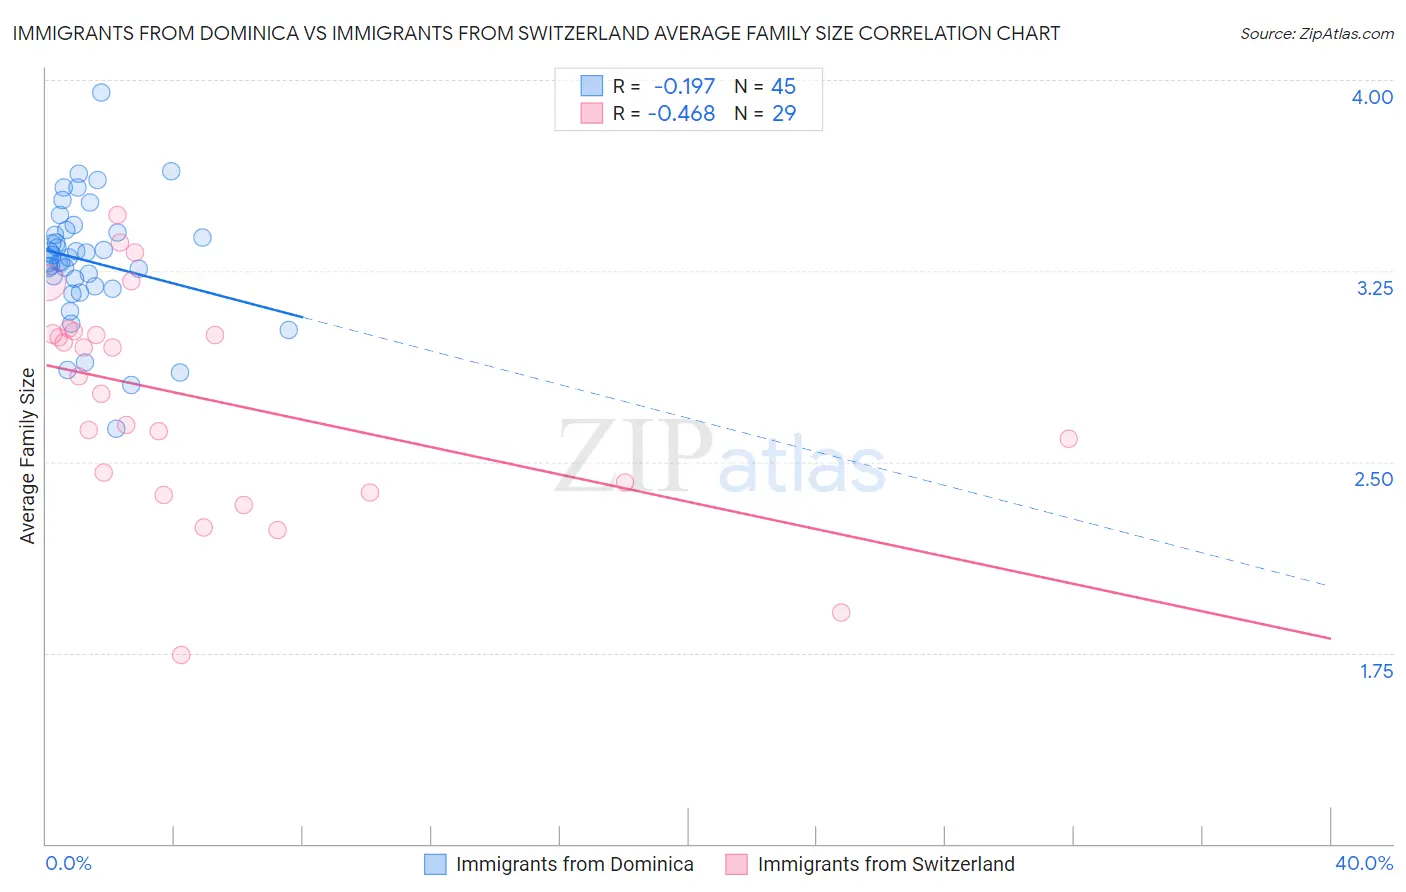
Immigrants from Dominica vs Immigrants from Switzerland Average Family Size Correlation Chart
The statistical analysis conducted on geographies consisting of 83,787,434 people shows a poor negative correlation between the proportion of Immigrants from Dominica and average family size in the United States with a correlation coefficient (R) of -0.197 and weighted average of 3.32. Similarly, the statistical analysis conducted on geographies consisting of 148,072,164 people shows a moderate negative correlation between the proportion of Immigrants from Switzerland and average family size in the United States with a correlation coefficient (R) of -0.468 and weighted average of 3.13, a difference of 5.9%.
Average Family Size Correlation Summary
| Measurement | Immigrants from Dominica | Immigrants from Switzerland |
| Minimum | 2.63 | 1.74 |
| Maximum | 3.95 | 3.47 |
| Range | 1.32 | 1.73 |
| Mean | 3.29 | 2.75 |
| Median | 3.30 | 2.84 |
| Interquartile 25% (IQ1) | 3.19 | 2.40 |
| Interquartile 75% (IQ3) | 3.41 | 3.01 |
| Interquartile Range (IQR) | 0.22 | 0.61 |
| Standard Deviation (Sample) | 0.24 | 0.43 |
| Standard Deviation (Population) | 0.24 | 0.42 |
Similar Demographics by Average Family Size
Demographics Similar to Immigrants from Dominica by Average Family Size
In terms of average family size, the demographic groups most similar to Immigrants from Dominica are Lumbee (3.32, a difference of 0.040%), Ecuadorian (3.32, a difference of 0.040%), Immigrants from Afghanistan (3.32, a difference of 0.050%), British West Indian (3.32, a difference of 0.060%), and Immigrants from Micronesia (3.32, a difference of 0.070%).
| Demographics | Rating | Rank | Average Family Size |
| Immigrants | Sierra Leone | 99.9 /100 | #74 | Exceptional 3.32 |
| Immigrants | Barbados | 99.8 /100 | #75 | Exceptional 3.32 |
| Trinidadians and Tobagonians | 99.8 /100 | #76 | Exceptional 3.32 |
| Immigrants | Ecuador | 99.8 /100 | #77 | Exceptional 3.32 |
| Immigrants | Micronesia | 99.8 /100 | #78 | Exceptional 3.32 |
| British West Indians | 99.8 /100 | #79 | Exceptional 3.32 |
| Lumbee | 99.8 /100 | #80 | Exceptional 3.32 |
| Immigrants | Dominica | 99.8 /100 | #81 | Exceptional 3.32 |
| Ecuadorians | 99.8 /100 | #82 | Exceptional 3.32 |
| Immigrants | Afghanistan | 99.8 /100 | #83 | Exceptional 3.32 |
| Immigrants | Nigeria | 99.7 /100 | #84 | Exceptional 3.32 |
| Afghans | 99.7 /100 | #85 | Exceptional 3.31 |
| Jamaicans | 99.7 /100 | #86 | Exceptional 3.31 |
| Immigrants | Peru | 99.7 /100 | #87 | Exceptional 3.31 |
| Immigrants | Bolivia | 99.6 /100 | #88 | Exceptional 3.31 |
Demographics Similar to Immigrants from Switzerland by Average Family Size
In terms of average family size, the demographic groups most similar to Immigrants from Switzerland are British (3.13, a difference of 0.020%), Macedonian (3.13, a difference of 0.030%), Immigrants from Latvia (3.13, a difference of 0.030%), Australian (3.13, a difference of 0.030%), and Immigrants from Ireland (3.13, a difference of 0.090%).
| Demographics | Rating | Rank | Average Family Size |
| Immigrants | Western Europe | 0.2 /100 | #297 | Tragic 3.14 |
| Colville | 0.2 /100 | #298 | Tragic 3.14 |
| Canadians | 0.2 /100 | #299 | Tragic 3.14 |
| Immigrants | Sweden | 0.2 /100 | #300 | Tragic 3.14 |
| Macedonians | 0.2 /100 | #301 | Tragic 3.13 |
| Immigrants | Latvia | 0.2 /100 | #302 | Tragic 3.13 |
| British | 0.2 /100 | #303 | Tragic 3.13 |
| Immigrants | Switzerland | 0.2 /100 | #304 | Tragic 3.13 |
| Australians | 0.1 /100 | #305 | Tragic 3.13 |
| Immigrants | Ireland | 0.1 /100 | #306 | Tragic 3.13 |
| Immigrants | Serbia | 0.1 /100 | #307 | Tragic 3.13 |
| Slavs | 0.1 /100 | #308 | Tragic 3.13 |
| Northern Europeans | 0.1 /100 | #309 | Tragic 3.13 |
| Czechoslovakians | 0.1 /100 | #310 | Tragic 3.13 |
| Immigrants | Northern Europe | 0.1 /100 | #311 | Tragic 3.13 |