Ethiopian vs Immigrants from Switzerland Unemployment Among Ages 35 to 44 years
COMPARE
Ethiopian
Immigrants from Switzerland
Unemployment Among Ages 35 to 44 years
Unemployment Among Ages 35 to 44 years Comparison
Ethiopians
Immigrants from Switzerland
4.5%
UNEMPLOYMENT AMONG AGES 35 TO 44 YEARS
87.1/ 100
METRIC RATING
120th/ 347
METRIC RANK
4.6%
UNEMPLOYMENT AMONG AGES 35 TO 44 YEARS
75.5/ 100
METRIC RATING
143rd/ 347
METRIC RANK
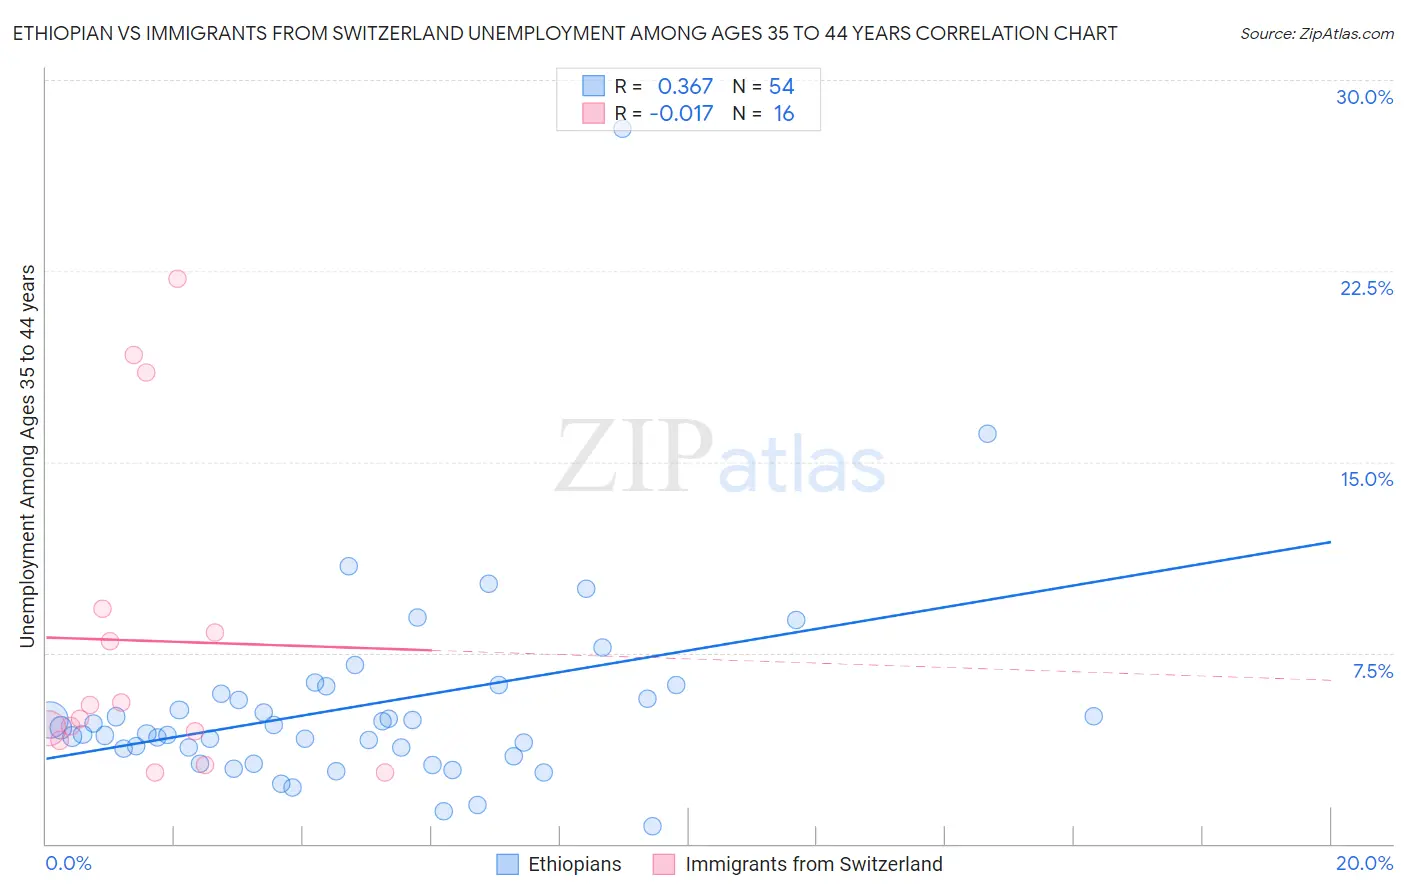
Ethiopian vs Immigrants from Switzerland Unemployment Among Ages 35 to 44 years Correlation Chart
The statistical analysis conducted on geographies consisting of 221,383,326 people shows a mild positive correlation between the proportion of Ethiopians and unemployment rate among population between the ages 35 and 44 in the United States with a correlation coefficient (R) of 0.367 and weighted average of 4.5%. Similarly, the statistical analysis conducted on geographies consisting of 146,486,829 people shows no correlation between the proportion of Immigrants from Switzerland and unemployment rate among population between the ages 35 and 44 in the United States with a correlation coefficient (R) of -0.017 and weighted average of 4.6%, a difference of 1.4%.
Unemployment Among Ages 35 to 44 years Correlation Summary
| Measurement | Ethiopian | Immigrants from Switzerland |
| Minimum | 0.70% | 2.8% |
| Maximum | 28.1% | 22.2% |
| Range | 27.4% | 19.4% |
| Mean | 5.4% | 8.0% |
| Median | 4.4% | 5.2% |
| Interquartile 25% (IQ1) | 3.7% | 4.2% |
| Interquartile 75% (IQ3) | 5.9% | 8.8% |
| Interquartile Range (IQR) | 2.1% | 4.5% |
| Standard Deviation (Sample) | 4.1% | 6.3% |
| Standard Deviation (Population) | 4.1% | 6.1% |
Similar Demographics by Unemployment Among Ages 35 to 44 years
Demographics Similar to Ethiopians by Unemployment Among Ages 35 to 44 years
In terms of unemployment among ages 35 to 44 years, the demographic groups most similar to Ethiopians are Immigrants from South Africa (4.5%, a difference of 0.040%), Sri Lankan (4.5%, a difference of 0.050%), Nicaraguan (4.5%, a difference of 0.080%), Basque (4.5%, a difference of 0.13%), and Irish (4.5%, a difference of 0.14%).
| Demographics | Rating | Rank | Unemployment Among Ages 35 to 44 years |
| Immigrants | Italy | 88.4 /100 | #113 | Excellent 4.5% |
| Macedonians | 88.3 /100 | #114 | Excellent 4.5% |
| Maltese | 88.1 /100 | #115 | Excellent 4.5% |
| Immigrants | Israel | 88.1 /100 | #116 | Excellent 4.5% |
| Immigrants | Greece | 87.9 /100 | #117 | Excellent 4.5% |
| Irish | 87.9 /100 | #118 | Excellent 4.5% |
| Nicaraguans | 87.6 /100 | #119 | Excellent 4.5% |
| Ethiopians | 87.1 /100 | #120 | Excellent 4.5% |
| Immigrants | South Africa | 86.8 /100 | #121 | Excellent 4.5% |
| Sri Lankans | 86.8 /100 | #122 | Excellent 4.5% |
| Basques | 86.3 /100 | #123 | Excellent 4.5% |
| Immigrants | Spain | 86.1 /100 | #124 | Excellent 4.5% |
| Immigrants | Northern Africa | 86.1 /100 | #125 | Excellent 4.5% |
| Immigrants | Austria | 84.7 /100 | #126 | Excellent 4.5% |
| Immigrants | Ethiopia | 84.7 /100 | #127 | Excellent 4.5% |
Demographics Similar to Immigrants from Switzerland by Unemployment Among Ages 35 to 44 years
In terms of unemployment among ages 35 to 44 years, the demographic groups most similar to Immigrants from Switzerland are Immigrants from Russia (4.6%, a difference of 0.010%), Ukrainian (4.6%, a difference of 0.030%), Immigrants from Eastern Africa (4.6%, a difference of 0.050%), Canadian (4.6%, a difference of 0.050%), and Immigrants from Hungary (4.6%, a difference of 0.080%).
| Demographics | Rating | Rank | Unemployment Among Ages 35 to 44 years |
| Scotch-Irish | 79.3 /100 | #136 | Good 4.6% |
| Immigrants | Iraq | 78.9 /100 | #137 | Good 4.6% |
| Immigrants | Norway | 77.5 /100 | #138 | Good 4.6% |
| Immigrants | Hungary | 76.3 /100 | #139 | Good 4.6% |
| Immigrants | Eastern Africa | 76.0 /100 | #140 | Good 4.6% |
| Canadians | 75.9 /100 | #141 | Good 4.6% |
| Ukrainians | 75.8 /100 | #142 | Good 4.6% |
| Immigrants | Switzerland | 75.5 /100 | #143 | Good 4.6% |
| Immigrants | Russia | 75.4 /100 | #144 | Good 4.6% |
| Immigrants | Eastern Europe | 74.7 /100 | #145 | Good 4.6% |
| Immigrants | Denmark | 74.4 /100 | #146 | Good 4.6% |
| Immigrants | Vietnam | 73.8 /100 | #147 | Good 4.6% |
| Slavs | 72.4 /100 | #148 | Good 4.6% |
| Immigrants | Burma/Myanmar | 72.2 /100 | #149 | Good 4.6% |
| Immigrants | England | 70.5 /100 | #150 | Good 4.6% |