Ethiopian vs Immigrants from Switzerland Female Poverty
COMPARE
Ethiopian
Immigrants from Switzerland
Female Poverty
Female Poverty Comparison
Ethiopians
Immigrants from Switzerland
13.3%
FEMALE POVERTY
62.3/ 100
METRIC RATING
164th/ 347
METRIC RANK
12.9%
FEMALE POVERTY
85.8/ 100
METRIC RATING
134th/ 347
METRIC RANK
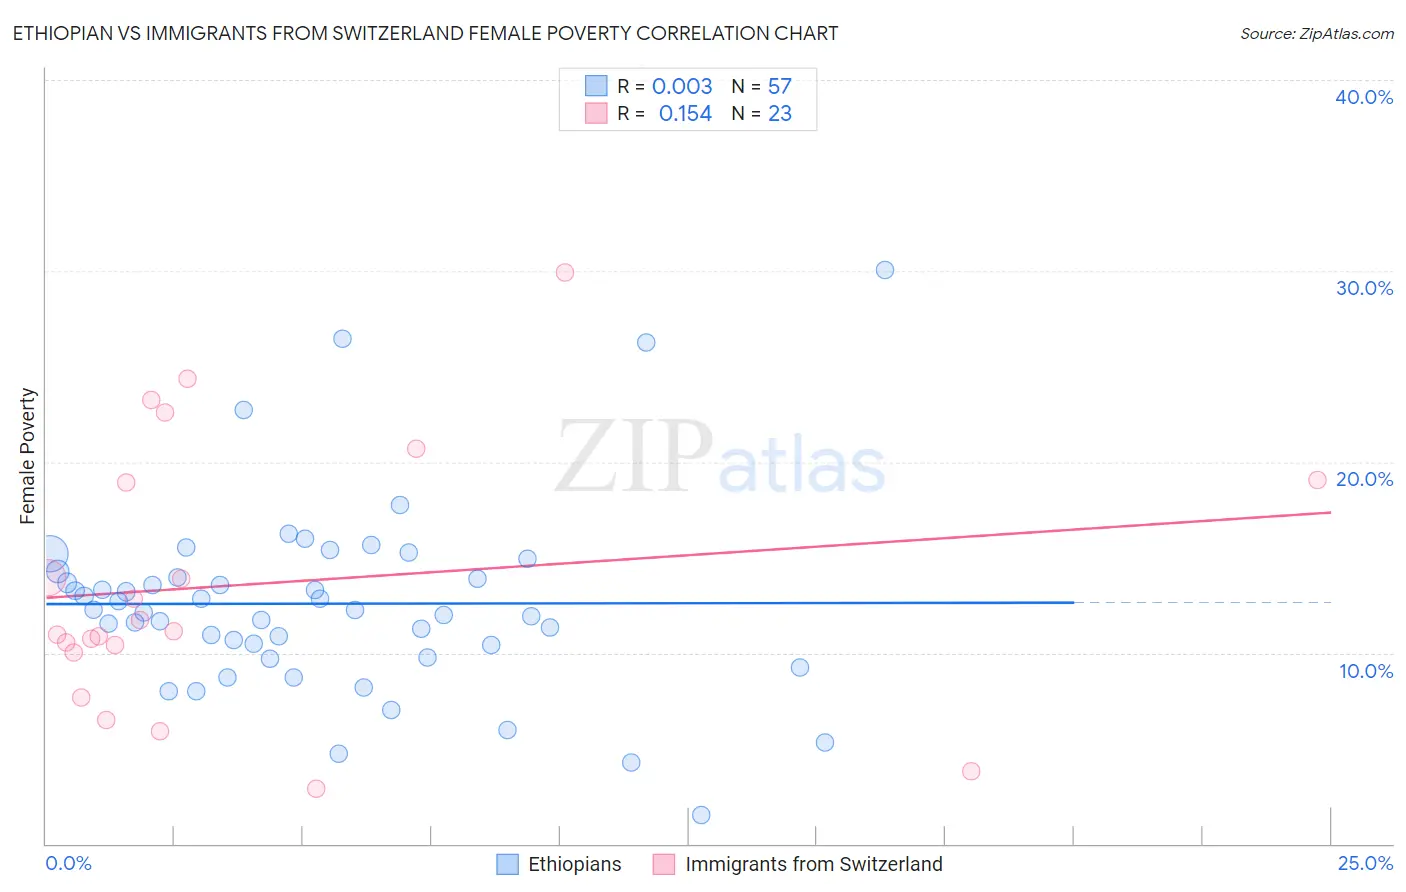
Ethiopian vs Immigrants from Switzerland Female Poverty Correlation Chart
The statistical analysis conducted on geographies consisting of 223,083,750 people shows no correlation between the proportion of Ethiopians and poverty level among females in the United States with a correlation coefficient (R) of 0.003 and weighted average of 13.3%. Similarly, the statistical analysis conducted on geographies consisting of 148,048,454 people shows a poor positive correlation between the proportion of Immigrants from Switzerland and poverty level among females in the United States with a correlation coefficient (R) of 0.154 and weighted average of 12.9%, a difference of 3.3%.
Female Poverty Correlation Summary
| Measurement | Ethiopian | Immigrants from Switzerland |
| Minimum | 1.5% | 2.9% |
| Maximum | 30.1% | 29.9% |
| Range | 28.6% | 27.0% |
| Mean | 12.6% | 13.6% |
| Median | 12.2% | 11.1% |
| Interquartile 25% (IQ1) | 10.1% | 10.0% |
| Interquartile 75% (IQ3) | 14.1% | 19.0% |
| Interquartile Range (IQR) | 4.0% | 9.0% |
| Standard Deviation (Sample) | 5.0% | 7.0% |
| Standard Deviation (Population) | 5.0% | 6.9% |
Similar Demographics by Female Poverty
Demographics Similar to Ethiopians by Female Poverty
In terms of female poverty, the demographic groups most similar to Ethiopians are Guamanian/Chamorro (13.3%, a difference of 0.010%), Immigrants from Albania (13.3%, a difference of 0.010%), Immigrants from Ethiopia (13.3%, a difference of 0.020%), Scotch-Irish (13.3%, a difference of 0.020%), and Immigrants from Nepal (13.3%, a difference of 0.050%).
| Demographics | Rating | Rank | Female Poverty |
| Immigrants | Northern Africa | 68.8 /100 | #157 | Good 13.2% |
| Pennsylvania Germans | 67.3 /100 | #158 | Good 13.2% |
| Costa Ricans | 63.6 /100 | #159 | Good 13.3% |
| Immigrants | Nepal | 62.7 /100 | #160 | Good 13.3% |
| Immigrants | Ethiopia | 62.5 /100 | #161 | Good 13.3% |
| Guamanians/Chamorros | 62.4 /100 | #162 | Good 13.3% |
| Immigrants | Albania | 62.4 /100 | #163 | Good 13.3% |
| Ethiopians | 62.3 /100 | #164 | Good 13.3% |
| Scotch-Irish | 62.1 /100 | #165 | Good 13.3% |
| Immigrants | Oceania | 59.7 /100 | #166 | Average 13.3% |
| Immigrants | Chile | 57.4 /100 | #167 | Average 13.3% |
| Aleuts | 56.7 /100 | #168 | Average 13.4% |
| Lebanese | 55.9 /100 | #169 | Average 13.4% |
| Colombians | 55.7 /100 | #170 | Average 13.4% |
| Whites/Caucasians | 54.6 /100 | #171 | Average 13.4% |
Demographics Similar to Immigrants from Switzerland by Female Poverty
In terms of female poverty, the demographic groups most similar to Immigrants from Switzerland are French (12.9%, a difference of 0.050%), Peruvian (12.9%, a difference of 0.13%), Immigrants from Western Europe (12.8%, a difference of 0.16%), Immigrants from Jordan (12.8%, a difference of 0.22%), and Chilean (12.9%, a difference of 0.22%).
| Demographics | Rating | Rank | Female Poverty |
| South Africans | 88.4 /100 | #127 | Excellent 12.8% |
| Immigrants | Belarus | 88.2 /100 | #128 | Excellent 12.8% |
| Immigrants | Brazil | 87.9 /100 | #129 | Excellent 12.8% |
| Immigrants | Vietnam | 87.1 /100 | #130 | Excellent 12.8% |
| Immigrants | Argentina | 87.0 /100 | #131 | Excellent 12.8% |
| Immigrants | Jordan | 86.9 /100 | #132 | Excellent 12.8% |
| Immigrants | Western Europe | 86.6 /100 | #133 | Excellent 12.8% |
| Immigrants | Switzerland | 85.8 /100 | #134 | Excellent 12.9% |
| French | 85.6 /100 | #135 | Excellent 12.9% |
| Peruvians | 85.2 /100 | #136 | Excellent 12.9% |
| Chileans | 84.7 /100 | #137 | Excellent 12.9% |
| Immigrants | France | 83.6 /100 | #138 | Excellent 12.9% |
| Basques | 83.1 /100 | #139 | Excellent 12.9% |
| Pakistanis | 83.0 /100 | #140 | Excellent 12.9% |
| Icelanders | 81.1 /100 | #141 | Excellent 13.0% |