Welsh vs Immigrants from Switzerland Average Family Size
COMPARE
Welsh
Immigrants from Switzerland
Average Family Size
Average Family Size Comparison
Welsh
Immigrants from Switzerland
3.12
AVERAGE FAMILY SIZE
0.1/ 100
METRIC RATING
319th/ 347
METRIC RANK
3.13
AVERAGE FAMILY SIZE
0.2/ 100
METRIC RATING
304th/ 347
METRIC RANK
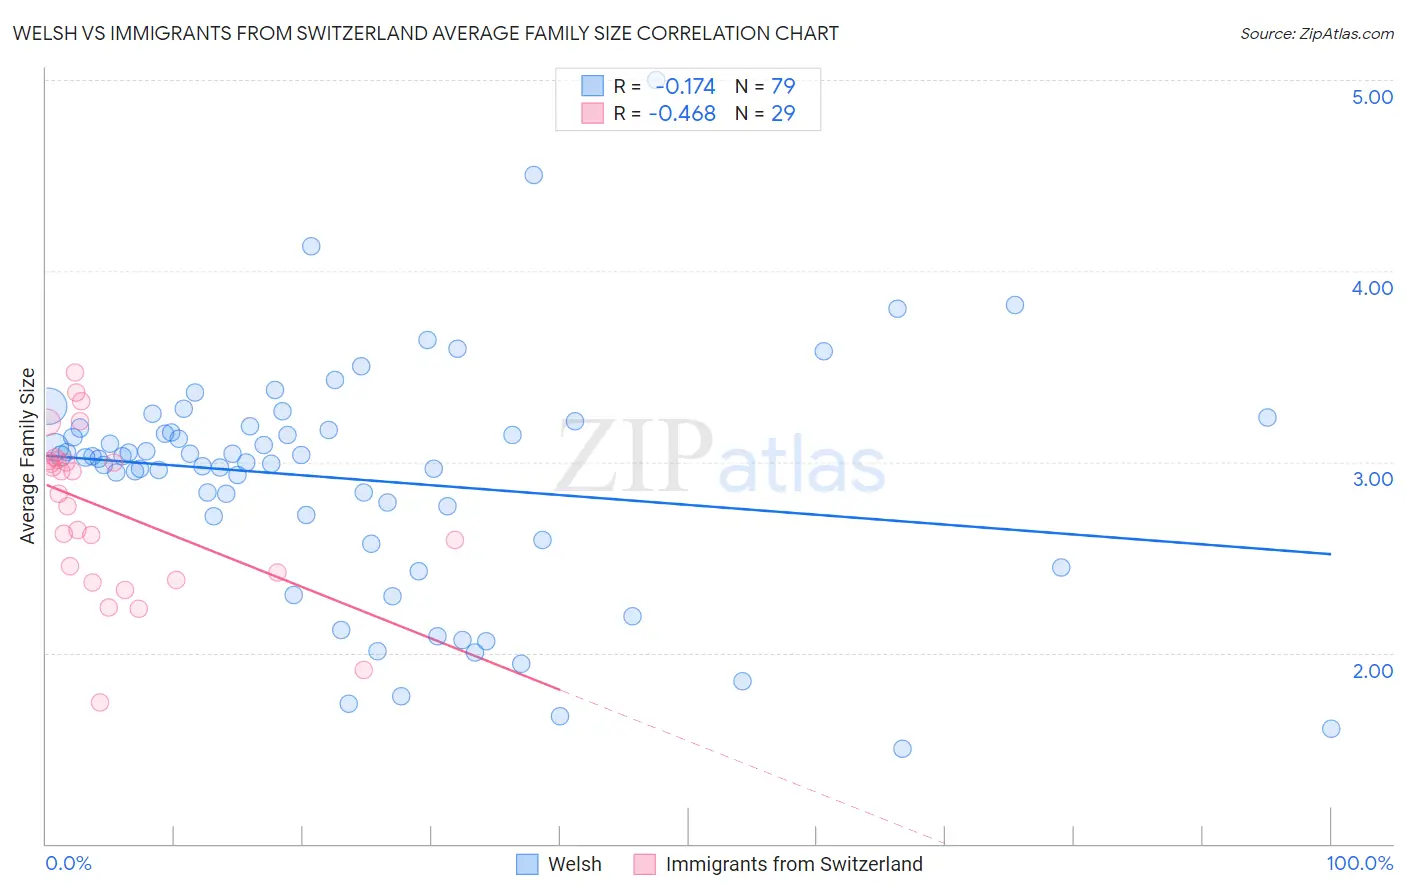
Welsh vs Immigrants from Switzerland Average Family Size Correlation Chart
The statistical analysis conducted on geographies consisting of 528,179,662 people shows a poor negative correlation between the proportion of Welsh and average family size in the United States with a correlation coefficient (R) of -0.174 and weighted average of 3.12. Similarly, the statistical analysis conducted on geographies consisting of 148,072,164 people shows a moderate negative correlation between the proportion of Immigrants from Switzerland and average family size in the United States with a correlation coefficient (R) of -0.468 and weighted average of 3.13, a difference of 0.47%.
Average Family Size Correlation Summary
| Measurement | Welsh | Immigrants from Switzerland |
| Minimum | 1.50 | 1.74 |
| Maximum | 5.00 | 3.47 |
| Range | 3.50 | 1.73 |
| Mean | 2.91 | 2.75 |
| Median | 3.02 | 2.84 |
| Interquartile 25% (IQ1) | 2.59 | 2.40 |
| Interquartile 75% (IQ3) | 3.18 | 3.01 |
| Interquartile Range (IQR) | 0.59 | 0.61 |
| Standard Deviation (Sample) | 0.62 | 0.43 |
| Standard Deviation (Population) | 0.62 | 0.42 |
Demographics Similar to Welsh and Immigrants from Switzerland by Average Family Size
In terms of average family size, the demographic groups most similar to Welsh are Eastern European (3.12, a difference of 0.0%), Italian (3.12, a difference of 0.010%), Serbian (3.12, a difference of 0.070%), Immigrants from North America (3.12, a difference of 0.070%), and Immigrants from Austria (3.12, a difference of 0.10%). Similarly, the demographic groups most similar to Immigrants from Switzerland are British (3.13, a difference of 0.020%), Macedonian (3.13, a difference of 0.030%), Immigrants from Latvia (3.13, a difference of 0.030%), Australian (3.13, a difference of 0.030%), and Immigrants from Ireland (3.13, a difference of 0.090%).
| Demographics | Rating | Rank | Average Family Size |
| Macedonians | 0.2 /100 | #301 | Tragic 3.13 |
| Immigrants | Latvia | 0.2 /100 | #302 | Tragic 3.13 |
| British | 0.2 /100 | #303 | Tragic 3.13 |
| Immigrants | Switzerland | 0.2 /100 | #304 | Tragic 3.13 |
| Australians | 0.1 /100 | #305 | Tragic 3.13 |
| Immigrants | Ireland | 0.1 /100 | #306 | Tragic 3.13 |
| Immigrants | Serbia | 0.1 /100 | #307 | Tragic 3.13 |
| Slavs | 0.1 /100 | #308 | Tragic 3.13 |
| Northern Europeans | 0.1 /100 | #309 | Tragic 3.13 |
| Czechoslovakians | 0.1 /100 | #310 | Tragic 3.13 |
| Immigrants | Northern Europe | 0.1 /100 | #311 | Tragic 3.13 |
| Immigrants | Australia | 0.1 /100 | #312 | Tragic 3.13 |
| Bulgarians | 0.1 /100 | #313 | Tragic 3.13 |
| Russians | 0.1 /100 | #314 | Tragic 3.12 |
| Immigrants | Scotland | 0.1 /100 | #315 | Tragic 3.12 |
| Serbians | 0.1 /100 | #316 | Tragic 3.12 |
| Italians | 0.1 /100 | #317 | Tragic 3.12 |
| Eastern Europeans | 0.1 /100 | #318 | Tragic 3.12 |
| Welsh | 0.1 /100 | #319 | Tragic 3.12 |
| Immigrants | North America | 0.0 /100 | #320 | Tragic 3.12 |
| Immigrants | Austria | 0.0 /100 | #321 | Tragic 3.12 |