Ethiopian vs Immigrants from Canada Average Family Size
COMPARE
Ethiopian
Immigrants from Canada
Average Family Size
Average Family Size Comparison
Ethiopians
Immigrants from Canada
3.24
AVERAGE FAMILY SIZE
63.9/ 100
METRIC RATING
159th/ 347
METRIC RANK
3.12
AVERAGE FAMILY SIZE
0.0/ 100
METRIC RATING
322nd/ 347
METRIC RANK
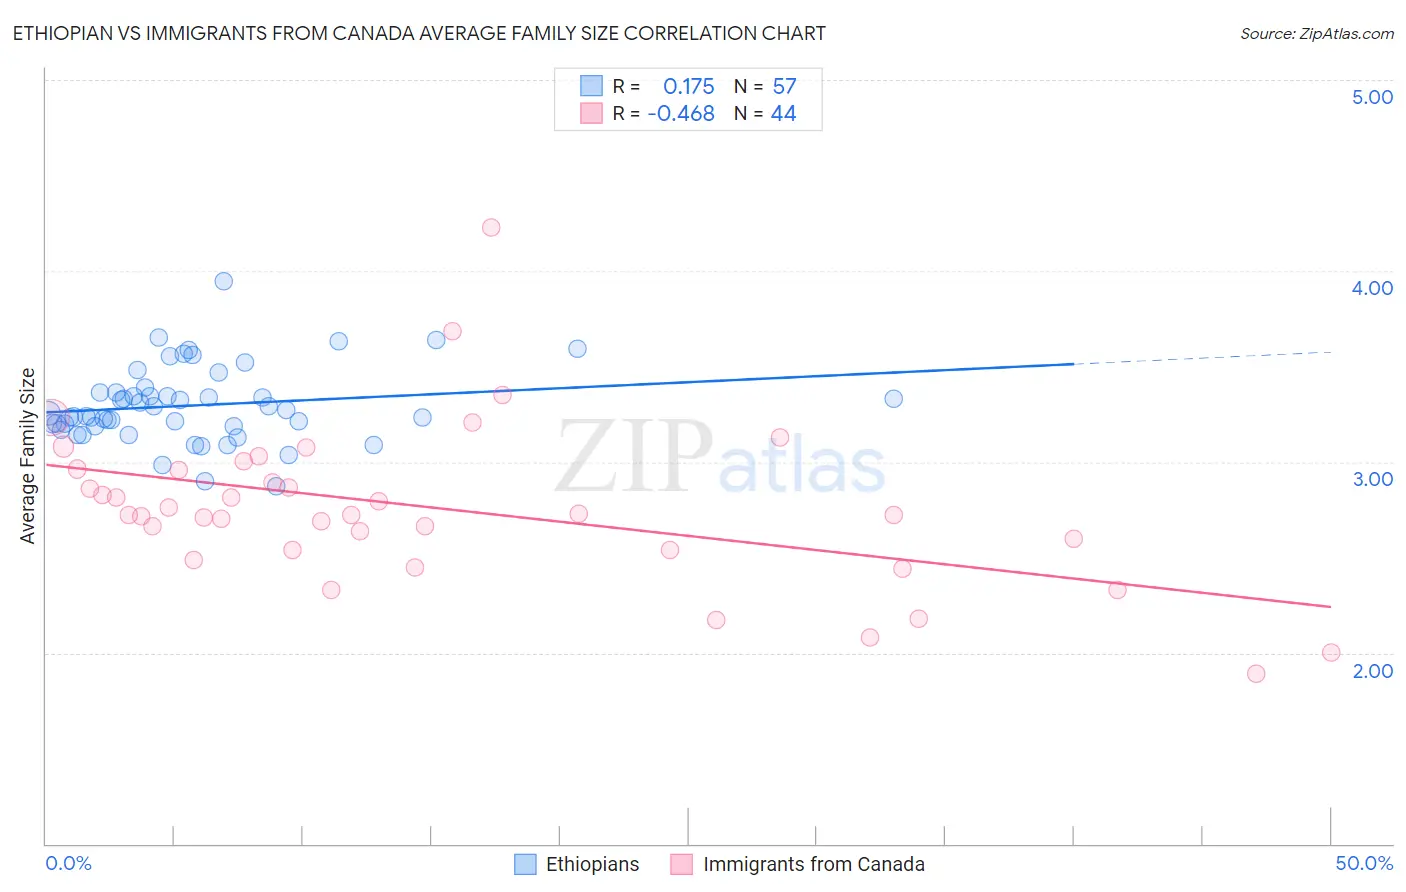
Ethiopian vs Immigrants from Canada Average Family Size Correlation Chart
The statistical analysis conducted on geographies consisting of 223,060,111 people shows a poor positive correlation between the proportion of Ethiopians and average family size in the United States with a correlation coefficient (R) of 0.175 and weighted average of 3.24. Similarly, the statistical analysis conducted on geographies consisting of 459,128,299 people shows a moderate negative correlation between the proportion of Immigrants from Canada and average family size in the United States with a correlation coefficient (R) of -0.468 and weighted average of 3.12, a difference of 3.9%.
Average Family Size Correlation Summary
| Measurement | Ethiopian | Immigrants from Canada |
| Minimum | 2.87 | 1.89 |
| Maximum | 3.94 | 4.23 |
| Range | 1.07 | 2.34 |
| Mean | 3.30 | 2.76 |
| Median | 3.25 | 2.72 |
| Interquartile 25% (IQ1) | 3.19 | 2.54 |
| Interquartile 75% (IQ3) | 3.36 | 2.96 |
| Interquartile Range (IQR) | 0.18 | 0.42 |
| Standard Deviation (Sample) | 0.20 | 0.42 |
| Standard Deviation (Population) | 0.20 | 0.42 |
Similar Demographics by Average Family Size
Demographics Similar to Ethiopians by Average Family Size
In terms of average family size, the demographic groups most similar to Ethiopians are Iraqi (3.24, a difference of 0.010%), Immigrants from Iraq (3.24, a difference of 0.010%), Immigrants from Chile (3.24, a difference of 0.010%), Immigrants from Uzbekistan (3.24, a difference of 0.060%), and Immigrants from Uganda (3.23, a difference of 0.070%).
| Demographics | Rating | Rank | Average Family Size |
| Spanish Americans | 72.5 /100 | #152 | Good 3.24 |
| Immigrants | Eritrea | 71.4 /100 | #153 | Good 3.24 |
| Immigrants | Egypt | 70.0 /100 | #154 | Good 3.24 |
| Seminole | 68.2 /100 | #155 | Good 3.24 |
| Immigrants | Taiwan | 68.1 /100 | #156 | Good 3.24 |
| Immigrants | Uzbekistan | 67.0 /100 | #157 | Good 3.24 |
| Iraqis | 64.3 /100 | #158 | Good 3.24 |
| Ethiopians | 63.9 /100 | #159 | Good 3.24 |
| Immigrants | Iraq | 63.7 /100 | #160 | Good 3.24 |
| Immigrants | Chile | 63.2 /100 | #161 | Good 3.24 |
| Immigrants | Uganda | 60.1 /100 | #162 | Good 3.23 |
| Uruguayans | 58.8 /100 | #163 | Average 3.23 |
| Egyptians | 58.6 /100 | #164 | Average 3.23 |
| Ugandans | 58.4 /100 | #165 | Average 3.23 |
| Immigrants | Senegal | 57.5 /100 | #166 | Average 3.23 |
Demographics Similar to Immigrants from Canada by Average Family Size
In terms of average family size, the demographic groups most similar to Immigrants from Canada are Immigrants from Austria (3.12, a difference of 0.0%), Immigrants from North America (3.12, a difference of 0.030%), Soviet Union (3.11, a difference of 0.030%), Eastern European (3.12, a difference of 0.11%), and Welsh (3.12, a difference of 0.11%).
| Demographics | Rating | Rank | Average Family Size |
| Immigrants | Scotland | 0.1 /100 | #315 | Tragic 3.12 |
| Serbians | 0.1 /100 | #316 | Tragic 3.12 |
| Italians | 0.1 /100 | #317 | Tragic 3.12 |
| Eastern Europeans | 0.1 /100 | #318 | Tragic 3.12 |
| Welsh | 0.1 /100 | #319 | Tragic 3.12 |
| Immigrants | North America | 0.0 /100 | #320 | Tragic 3.12 |
| Immigrants | Austria | 0.0 /100 | #321 | Tragic 3.12 |
| Immigrants | Canada | 0.0 /100 | #322 | Tragic 3.12 |
| Soviet Union | 0.0 /100 | #323 | Tragic 3.11 |
| Celtics | 0.0 /100 | #324 | Tragic 3.11 |
| English | 0.0 /100 | #325 | Tragic 3.11 |
| Ottawa | 0.0 /100 | #326 | Tragic 3.11 |
| Dutch | 0.0 /100 | #327 | Tragic 3.11 |
| Czechs | 0.0 /100 | #328 | Tragic 3.11 |
| Belgians | 0.0 /100 | #329 | Tragic 3.11 |