Indonesian vs Immigrants from Switzerland Average Family Size
COMPARE
Indonesian
Immigrants from Switzerland
Average Family Size
Average Family Size Comparison
Indonesians
Immigrants from Switzerland
3.28
AVERAGE FAMILY SIZE
96.2/ 100
METRIC RATING
111th/ 347
METRIC RANK
3.13
AVERAGE FAMILY SIZE
0.2/ 100
METRIC RATING
304th/ 347
METRIC RANK
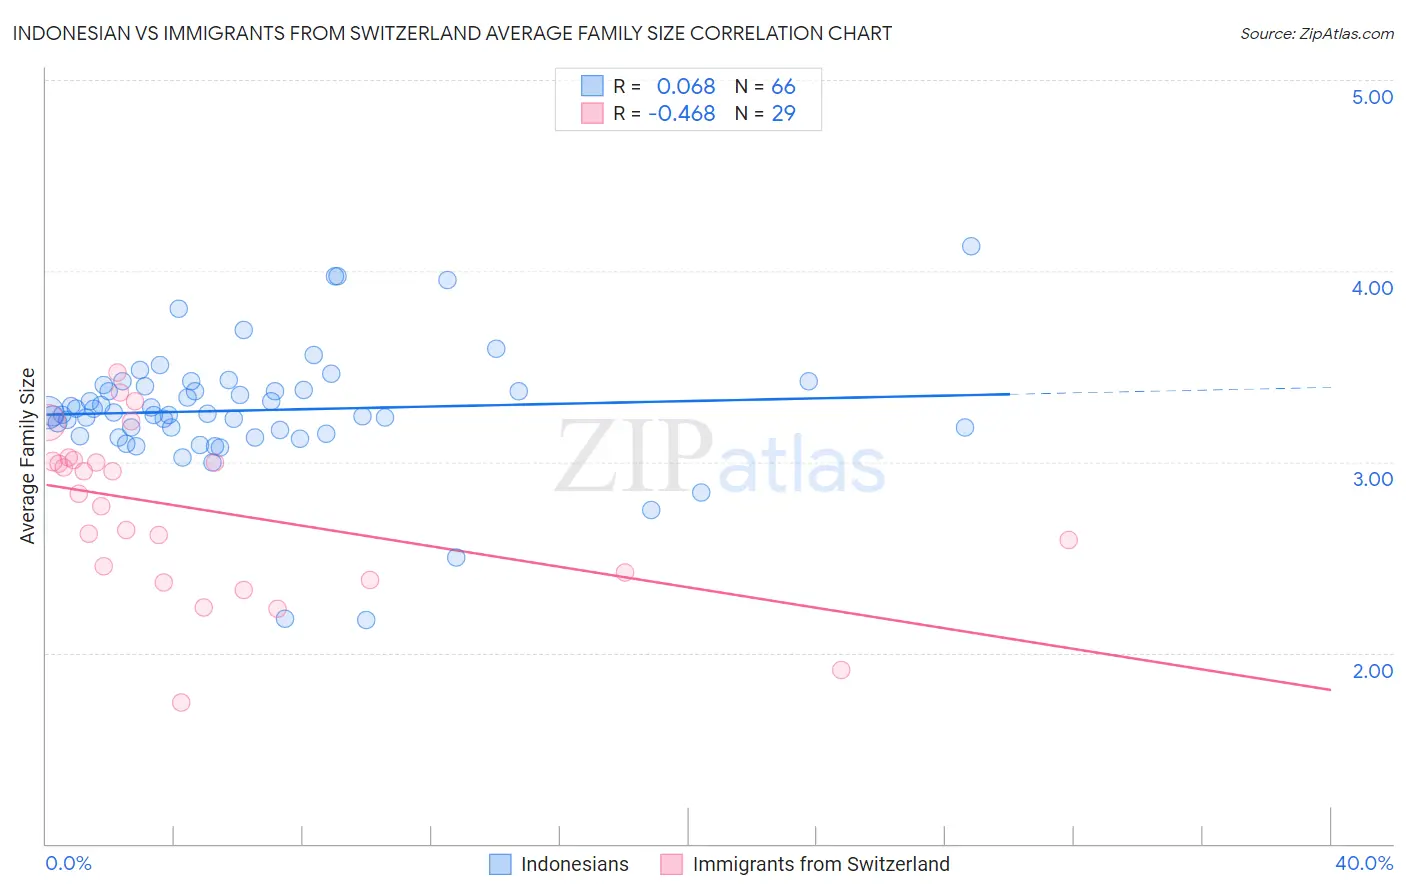
Indonesian vs Immigrants from Switzerland Average Family Size Correlation Chart
The statistical analysis conducted on geographies consisting of 162,608,656 people shows a slight positive correlation between the proportion of Indonesians and average family size in the United States with a correlation coefficient (R) of 0.068 and weighted average of 3.28. Similarly, the statistical analysis conducted on geographies consisting of 148,072,164 people shows a moderate negative correlation between the proportion of Immigrants from Switzerland and average family size in the United States with a correlation coefficient (R) of -0.468 and weighted average of 3.13, a difference of 4.5%.
Average Family Size Correlation Summary
| Measurement | Indonesian | Immigrants from Switzerland |
| Minimum | 2.17 | 1.74 |
| Maximum | 4.13 | 3.47 |
| Range | 1.96 | 1.73 |
| Mean | 3.27 | 2.75 |
| Median | 3.25 | 2.84 |
| Interquartile 25% (IQ1) | 3.15 | 2.40 |
| Interquartile 75% (IQ3) | 3.40 | 3.01 |
| Interquartile Range (IQR) | 0.25 | 0.61 |
| Standard Deviation (Sample) | 0.33 | 0.43 |
| Standard Deviation (Population) | 0.33 | 0.42 |
Similar Demographics by Average Family Size
Demographics Similar to Indonesians by Average Family Size
In terms of average family size, the demographic groups most similar to Indonesians are Bahamian (3.28, a difference of 0.050%), Puerto Rican (3.28, a difference of 0.060%), Black/African American (3.27, a difference of 0.060%), Immigrants from Panama (3.27, a difference of 0.070%), and Asian (3.28, a difference of 0.11%).
| Demographics | Rating | Rank | Average Family Size |
| Bolivians | 98.3 /100 | #104 | Exceptional 3.29 |
| Immigrants | Ghana | 98.1 /100 | #105 | Exceptional 3.29 |
| Paiute | 98.0 /100 | #106 | Exceptional 3.29 |
| Ghanaians | 98.0 /100 | #107 | Exceptional 3.29 |
| Asians | 97.0 /100 | #108 | Exceptional 3.28 |
| Puerto Ricans | 96.7 /100 | #109 | Exceptional 3.28 |
| Bahamians | 96.6 /100 | #110 | Exceptional 3.28 |
| Indonesians | 96.2 /100 | #111 | Exceptional 3.28 |
| Blacks/African Americans | 95.7 /100 | #112 | Exceptional 3.27 |
| Immigrants | Panama | 95.6 /100 | #113 | Exceptional 3.27 |
| South Americans | 95.1 /100 | #114 | Exceptional 3.27 |
| Immigrants | Liberia | 95.0 /100 | #115 | Exceptional 3.27 |
| Immigrants | South America | 95.0 /100 | #116 | Exceptional 3.27 |
| Kiowa | 94.8 /100 | #117 | Exceptional 3.27 |
| Immigrants | Asia | 94.0 /100 | #118 | Exceptional 3.27 |
Demographics Similar to Immigrants from Switzerland by Average Family Size
In terms of average family size, the demographic groups most similar to Immigrants from Switzerland are British (3.13, a difference of 0.020%), Macedonian (3.13, a difference of 0.030%), Immigrants from Latvia (3.13, a difference of 0.030%), Australian (3.13, a difference of 0.030%), and Immigrants from Ireland (3.13, a difference of 0.090%).
| Demographics | Rating | Rank | Average Family Size |
| Immigrants | Western Europe | 0.2 /100 | #297 | Tragic 3.14 |
| Colville | 0.2 /100 | #298 | Tragic 3.14 |
| Canadians | 0.2 /100 | #299 | Tragic 3.14 |
| Immigrants | Sweden | 0.2 /100 | #300 | Tragic 3.14 |
| Macedonians | 0.2 /100 | #301 | Tragic 3.13 |
| Immigrants | Latvia | 0.2 /100 | #302 | Tragic 3.13 |
| British | 0.2 /100 | #303 | Tragic 3.13 |
| Immigrants | Switzerland | 0.2 /100 | #304 | Tragic 3.13 |
| Australians | 0.1 /100 | #305 | Tragic 3.13 |
| Immigrants | Ireland | 0.1 /100 | #306 | Tragic 3.13 |
| Immigrants | Serbia | 0.1 /100 | #307 | Tragic 3.13 |
| Slavs | 0.1 /100 | #308 | Tragic 3.13 |
| Northern Europeans | 0.1 /100 | #309 | Tragic 3.13 |
| Czechoslovakians | 0.1 /100 | #310 | Tragic 3.13 |
| Immigrants | Northern Europe | 0.1 /100 | #311 | Tragic 3.13 |