Ethiopian vs Bhutanese Average Family Size
COMPARE
Ethiopian
Bhutanese
Average Family Size
Average Family Size Comparison
Ethiopians
Bhutanese
3.24
AVERAGE FAMILY SIZE
63.9/ 100
METRIC RATING
159th/ 347
METRIC RANK
3.25
AVERAGE FAMILY SIZE
81.0/ 100
METRIC RATING
143rd/ 347
METRIC RANK
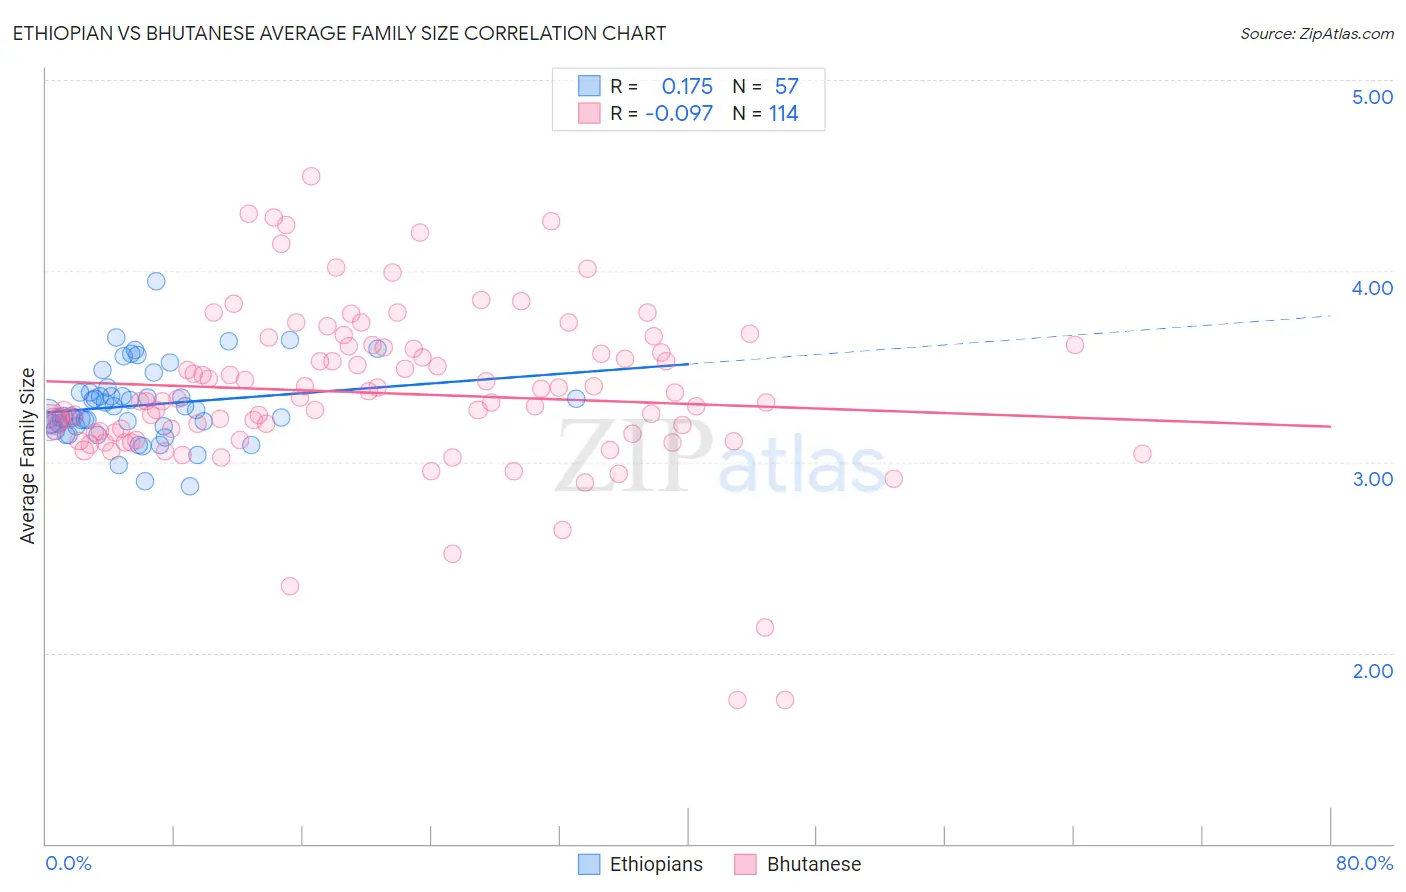
Ethiopian vs Bhutanese Average Family Size Correlation Chart
The statistical analysis conducted on geographies consisting of 223,060,111 people shows a poor positive correlation between the proportion of Ethiopians and average family size in the United States with a correlation coefficient (R) of 0.175 and weighted average of 3.24. Similarly, the statistical analysis conducted on geographies consisting of 455,147,723 people shows a slight negative correlation between the proportion of Bhutanese and average family size in the United States with a correlation coefficient (R) of -0.097 and weighted average of 3.25, a difference of 0.40%.
Average Family Size Correlation Summary
| Measurement | Ethiopian | Bhutanese |
| Minimum | 2.87 | 1.75 |
| Maximum | 3.94 | 4.49 |
| Range | 1.07 | 2.74 |
| Mean | 3.30 | 3.36 |
| Median | 3.25 | 3.32 |
| Interquartile 25% (IQ1) | 3.19 | 3.15 |
| Interquartile 75% (IQ3) | 3.36 | 3.60 |
| Interquartile Range (IQR) | 0.18 | 0.45 |
| Standard Deviation (Sample) | 0.20 | 0.44 |
| Standard Deviation (Population) | 0.20 | 0.44 |
Demographics Similar to Ethiopians and Bhutanese by Average Family Size
In terms of average family size, the demographic groups most similar to Ethiopians are Iraqi (3.24, a difference of 0.010%), Immigrants from Iraq (3.24, a difference of 0.010%), Immigrants from Chile (3.24, a difference of 0.010%), Immigrants from Uzbekistan (3.24, a difference of 0.060%), and Immigrants from Taiwan (3.24, a difference of 0.080%). Similarly, the demographic groups most similar to Bhutanese are Venezuelan (3.25, a difference of 0.010%), Liberian (3.25, a difference of 0.010%), Tsimshian (3.25, a difference of 0.020%), Armenian (3.25, a difference of 0.080%), and Immigrants from Africa (3.25, a difference of 0.090%).
| Demographics | Rating | Rank | Average Family Size |
| Venezuelans | 81.4 /100 | #141 | Excellent 3.25 |
| Liberians | 81.2 /100 | #142 | Excellent 3.25 |
| Bhutanese | 81.0 /100 | #143 | Excellent 3.25 |
| Tsimshian | 80.2 /100 | #144 | Excellent 3.25 |
| Armenians | 78.2 /100 | #145 | Good 3.25 |
| Immigrants | Africa | 77.9 /100 | #146 | Good 3.25 |
| Immigrants | Jordan | 75.7 /100 | #147 | Good 3.24 |
| Blackfeet | 75.0 /100 | #148 | Good 3.24 |
| Assyrians/Chaldeans/Syriacs | 73.8 /100 | #149 | Good 3.24 |
| Indians (Asian) | 73.6 /100 | #150 | Good 3.24 |
| Jordanians | 73.5 /100 | #151 | Good 3.24 |
| Spanish Americans | 72.5 /100 | #152 | Good 3.24 |
| Immigrants | Eritrea | 71.4 /100 | #153 | Good 3.24 |
| Immigrants | Egypt | 70.0 /100 | #154 | Good 3.24 |
| Seminole | 68.2 /100 | #155 | Good 3.24 |
| Immigrants | Taiwan | 68.1 /100 | #156 | Good 3.24 |
| Immigrants | Uzbekistan | 67.0 /100 | #157 | Good 3.24 |
| Iraqis | 64.3 /100 | #158 | Good 3.24 |
| Ethiopians | 63.9 /100 | #159 | Good 3.24 |
| Immigrants | Iraq | 63.7 /100 | #160 | Good 3.24 |
| Immigrants | Chile | 63.2 /100 | #161 | Good 3.24 |