Slovene vs Immigrants from Somalia Currently Married
COMPARE
Slovene
Immigrants from Somalia
Currently Married
Currently Married Comparison
Slovenes
Immigrants from Somalia
48.1%
CURRENTLY MARRIED
97.1/ 100
METRIC RATING
77th/ 347
METRIC RANK
41.2%
CURRENTLY MARRIED
0.0/ 100
METRIC RATING
319th/ 347
METRIC RANK
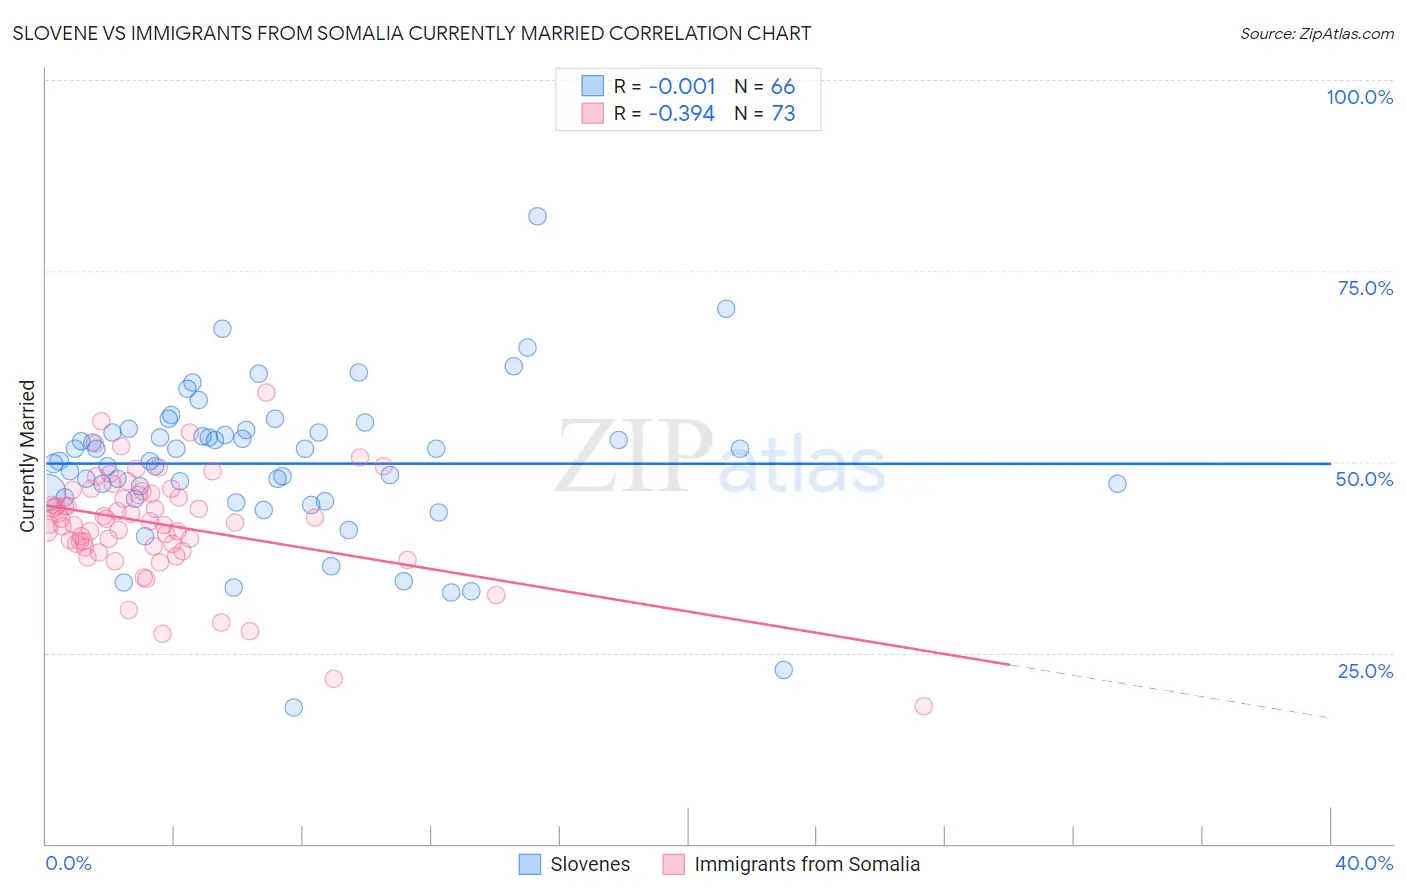
Slovene vs Immigrants from Somalia Currently Married Correlation Chart
The statistical analysis conducted on geographies consisting of 261,329,458 people shows no correlation between the proportion of Slovenes and percentage of population currently married in the United States with a correlation coefficient (R) of -0.001 and weighted average of 48.1%. Similarly, the statistical analysis conducted on geographies consisting of 92,108,089 people shows a mild negative correlation between the proportion of Immigrants from Somalia and percentage of population currently married in the United States with a correlation coefficient (R) of -0.394 and weighted average of 41.2%, a difference of 16.9%.
Currently Married Correlation Summary
| Measurement | Slovene | Immigrants from Somalia |
| Minimum | 17.9% | 18.0% |
| Maximum | 82.2% | 59.1% |
| Range | 64.3% | 41.1% |
| Mean | 49.8% | 41.9% |
| Median | 50.9% | 42.3% |
| Interquartile 25% (IQ1) | 45.4% | 39.1% |
| Interquartile 75% (IQ3) | 53.8% | 45.9% |
| Interquartile Range (IQR) | 8.5% | 6.8% |
| Standard Deviation (Sample) | 10.2% | 7.0% |
| Standard Deviation (Population) | 10.1% | 6.9% |
Similar Demographics by Currently Married
Demographics Similar to Slovenes by Currently Married
In terms of currently married, the demographic groups most similar to Slovenes are Immigrants from Belgium (48.1%, a difference of 0.010%), Basque (48.1%, a difference of 0.020%), Immigrants from South Africa (48.1%, a difference of 0.020%), Immigrants from Belarus (48.1%, a difference of 0.050%), and Immigrants from Poland (48.1%, a difference of 0.050%).
| Demographics | Rating | Rank | Currently Married |
| Immigrants | Asia | 97.9 /100 | #70 | Exceptional 48.3% |
| Macedonians | 97.9 /100 | #71 | Exceptional 48.3% |
| Immigrants | Lebanon | 97.6 /100 | #72 | Exceptional 48.2% |
| Immigrants | Eastern Asia | 97.5 /100 | #73 | Exceptional 48.2% |
| Estonians | 97.4 /100 | #74 | Exceptional 48.2% |
| Immigrants | Belarus | 97.2 /100 | #75 | Exceptional 48.1% |
| Basques | 97.2 /100 | #76 | Exceptional 48.1% |
| Slovenes | 97.1 /100 | #77 | Exceptional 48.1% |
| Immigrants | Belgium | 97.1 /100 | #78 | Exceptional 48.1% |
| Immigrants | South Africa | 97.0 /100 | #79 | Exceptional 48.1% |
| Immigrants | Poland | 96.9 /100 | #80 | Exceptional 48.1% |
| Immigrants | Sri Lanka | 96.9 /100 | #81 | Exceptional 48.1% |
| Immigrants | Europe | 96.9 /100 | #82 | Exceptional 48.1% |
| Bolivians | 96.9 /100 | #83 | Exceptional 48.1% |
| Immigrants | Israel | 96.9 /100 | #84 | Exceptional 48.1% |
Demographics Similar to Immigrants from Somalia by Currently Married
In terms of currently married, the demographic groups most similar to Immigrants from Somalia are Bahamian (41.2%, a difference of 0.020%), Immigrants from Jamaica (41.1%, a difference of 0.060%), Haitian (41.3%, a difference of 0.20%), Immigrants from Caribbean (41.3%, a difference of 0.22%), and Inupiat (41.3%, a difference of 0.28%).
| Demographics | Rating | Rank | Currently Married |
| Somalis | 0.0 /100 | #312 | Tragic 41.5% |
| Jamaicans | 0.0 /100 | #313 | Tragic 41.4% |
| West Indians | 0.0 /100 | #314 | Tragic 41.3% |
| Inupiat | 0.0 /100 | #315 | Tragic 41.3% |
| Immigrants | Caribbean | 0.0 /100 | #316 | Tragic 41.3% |
| Haitians | 0.0 /100 | #317 | Tragic 41.3% |
| Bahamians | 0.0 /100 | #318 | Tragic 41.2% |
| Immigrants | Somalia | 0.0 /100 | #319 | Tragic 41.2% |
| Immigrants | Jamaica | 0.0 /100 | #320 | Tragic 41.1% |
| Immigrants | Congo | 0.0 /100 | #321 | Tragic 41.1% |
| Immigrants | Haiti | 0.0 /100 | #322 | Tragic 41.0% |
| Immigrants | West Indies | 0.0 /100 | #323 | Tragic 40.7% |
| Immigrants | Senegal | 0.0 /100 | #324 | Tragic 40.7% |
| U.S. Virgin Islanders | 0.0 /100 | #325 | Tragic 40.7% |
| Barbadians | 0.0 /100 | #326 | Tragic 40.6% |