White/Caucasian vs Immigrants from Somalia Currently Married
COMPARE
White/Caucasian
Immigrants from Somalia
Currently Married
Currently Married Comparison
Whites/Caucasians
Immigrants from Somalia
48.6%
CURRENTLY MARRIED
99.0/ 100
METRIC RATING
51st/ 347
METRIC RANK
41.2%
CURRENTLY MARRIED
0.0/ 100
METRIC RATING
319th/ 347
METRIC RANK
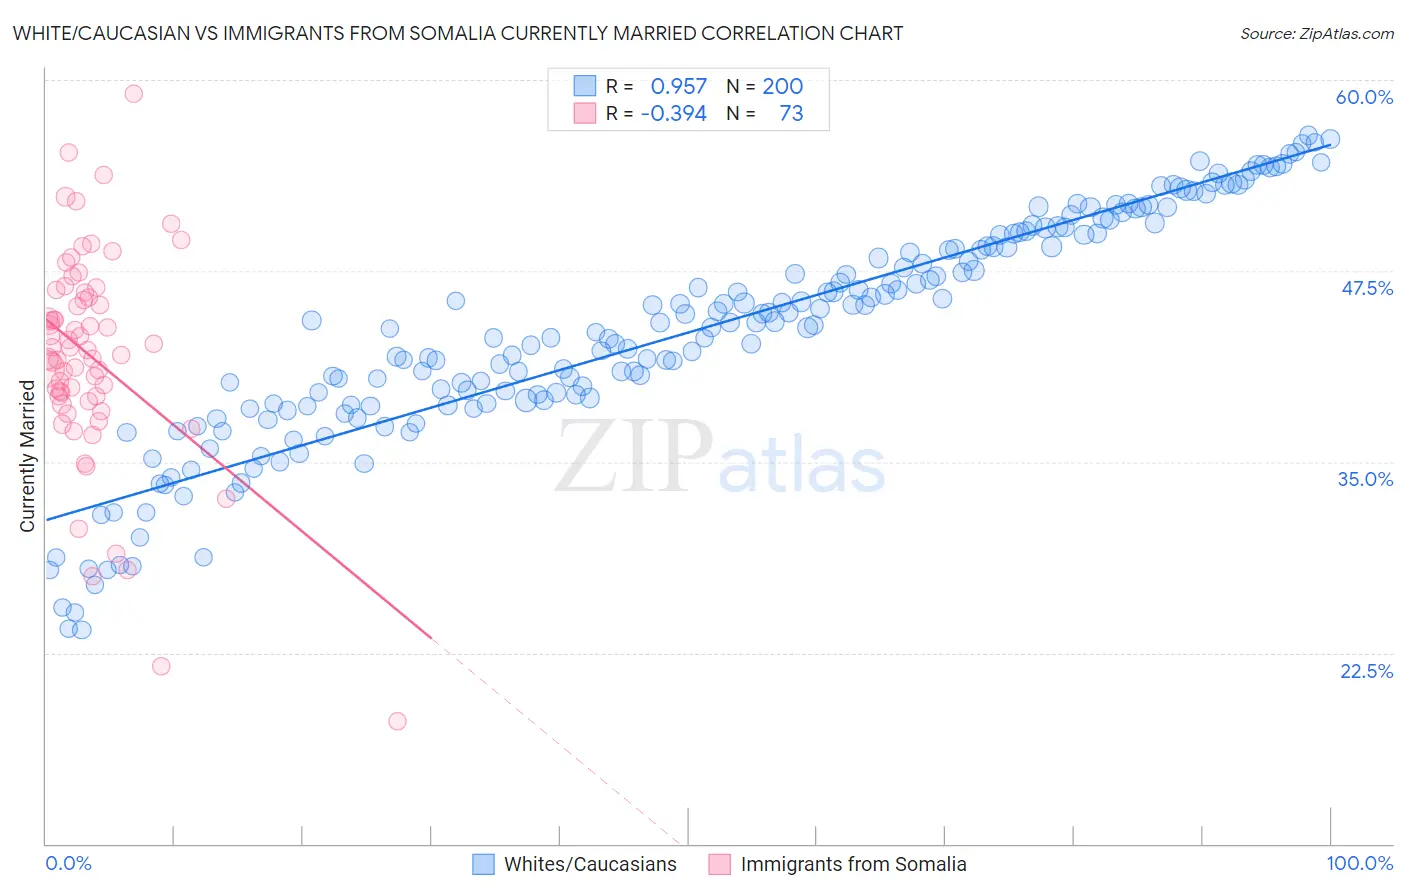
White/Caucasian vs Immigrants from Somalia Currently Married Correlation Chart
The statistical analysis conducted on geographies consisting of 585,061,010 people shows a perfect positive correlation between the proportion of Whites/Caucasians and percentage of population currently married in the United States with a correlation coefficient (R) of 0.957 and weighted average of 48.6%. Similarly, the statistical analysis conducted on geographies consisting of 92,108,089 people shows a mild negative correlation between the proportion of Immigrants from Somalia and percentage of population currently married in the United States with a correlation coefficient (R) of -0.394 and weighted average of 41.2%, a difference of 18.0%.
Currently Married Correlation Summary
| Measurement | White/Caucasian | Immigrants from Somalia |
| Minimum | 24.0% | 18.0% |
| Maximum | 56.4% | 59.1% |
| Range | 32.4% | 41.1% |
| Mean | 43.5% | 41.9% |
| Median | 44.0% | 42.3% |
| Interquartile 25% (IQ1) | 38.8% | 39.1% |
| Interquartile 75% (IQ3) | 49.5% | 45.9% |
| Interquartile Range (IQR) | 10.7% | 6.8% |
| Standard Deviation (Sample) | 7.4% | 7.0% |
| Standard Deviation (Population) | 7.4% | 6.9% |
Similar Demographics by Currently Married
Demographics Similar to Whites/Caucasians by Currently Married
In terms of currently married, the demographic groups most similar to Whites/Caucasians are Iranian (48.6%, a difference of 0.010%), Bhutanese (48.6%, a difference of 0.070%), Russian (48.6%, a difference of 0.090%), Austrian (48.7%, a difference of 0.20%), and Immigrants from Austria (48.5%, a difference of 0.20%).
| Demographics | Rating | Rank | Currently Married |
| Immigrants | North America | 99.3 /100 | #44 | Exceptional 48.7% |
| Belgians | 99.3 /100 | #45 | Exceptional 48.7% |
| Immigrants | Iran | 99.2 /100 | #46 | Exceptional 48.7% |
| Northern Europeans | 99.2 /100 | #47 | Exceptional 48.7% |
| Austrians | 99.2 /100 | #48 | Exceptional 48.7% |
| Bhutanese | 99.1 /100 | #49 | Exceptional 48.6% |
| Iranians | 99.0 /100 | #50 | Exceptional 48.6% |
| Whites/Caucasians | 99.0 /100 | #51 | Exceptional 48.6% |
| Russians | 98.9 /100 | #52 | Exceptional 48.6% |
| Immigrants | Austria | 98.8 /100 | #53 | Exceptional 48.5% |
| Immigrants | Moldova | 98.7 /100 | #54 | Exceptional 48.5% |
| Immigrants | North Macedonia | 98.7 /100 | #55 | Exceptional 48.5% |
| Latvians | 98.7 /100 | #56 | Exceptional 48.5% |
| Immigrants | Netherlands | 98.6 /100 | #57 | Exceptional 48.5% |
| French | 98.6 /100 | #58 | Exceptional 48.4% |
Demographics Similar to Immigrants from Somalia by Currently Married
In terms of currently married, the demographic groups most similar to Immigrants from Somalia are Bahamian (41.2%, a difference of 0.020%), Immigrants from Jamaica (41.1%, a difference of 0.060%), Haitian (41.3%, a difference of 0.20%), Immigrants from Caribbean (41.3%, a difference of 0.22%), and Inupiat (41.3%, a difference of 0.28%).
| Demographics | Rating | Rank | Currently Married |
| Somalis | 0.0 /100 | #312 | Tragic 41.5% |
| Jamaicans | 0.0 /100 | #313 | Tragic 41.4% |
| West Indians | 0.0 /100 | #314 | Tragic 41.3% |
| Inupiat | 0.0 /100 | #315 | Tragic 41.3% |
| Immigrants | Caribbean | 0.0 /100 | #316 | Tragic 41.3% |
| Haitians | 0.0 /100 | #317 | Tragic 41.3% |
| Bahamians | 0.0 /100 | #318 | Tragic 41.2% |
| Immigrants | Somalia | 0.0 /100 | #319 | Tragic 41.2% |
| Immigrants | Jamaica | 0.0 /100 | #320 | Tragic 41.1% |
| Immigrants | Congo | 0.0 /100 | #321 | Tragic 41.1% |
| Immigrants | Haiti | 0.0 /100 | #322 | Tragic 41.0% |
| Immigrants | West Indies | 0.0 /100 | #323 | Tragic 40.7% |
| Immigrants | Senegal | 0.0 /100 | #324 | Tragic 40.7% |
| U.S. Virgin Islanders | 0.0 /100 | #325 | Tragic 40.7% |
| Barbadians | 0.0 /100 | #326 | Tragic 40.6% |