Immigrants from Eritrea vs Immigrants from North America Currently Married
COMPARE
Immigrants from Eritrea
Immigrants from North America
Currently Married
Currently Married Comparison
Immigrants from Eritrea
Immigrants from North America
43.6%
CURRENTLY MARRIED
0.1/ 100
METRIC RATING
267th/ 347
METRIC RANK
48.7%
CURRENTLY MARRIED
99.3/ 100
METRIC RATING
44th/ 347
METRIC RANK
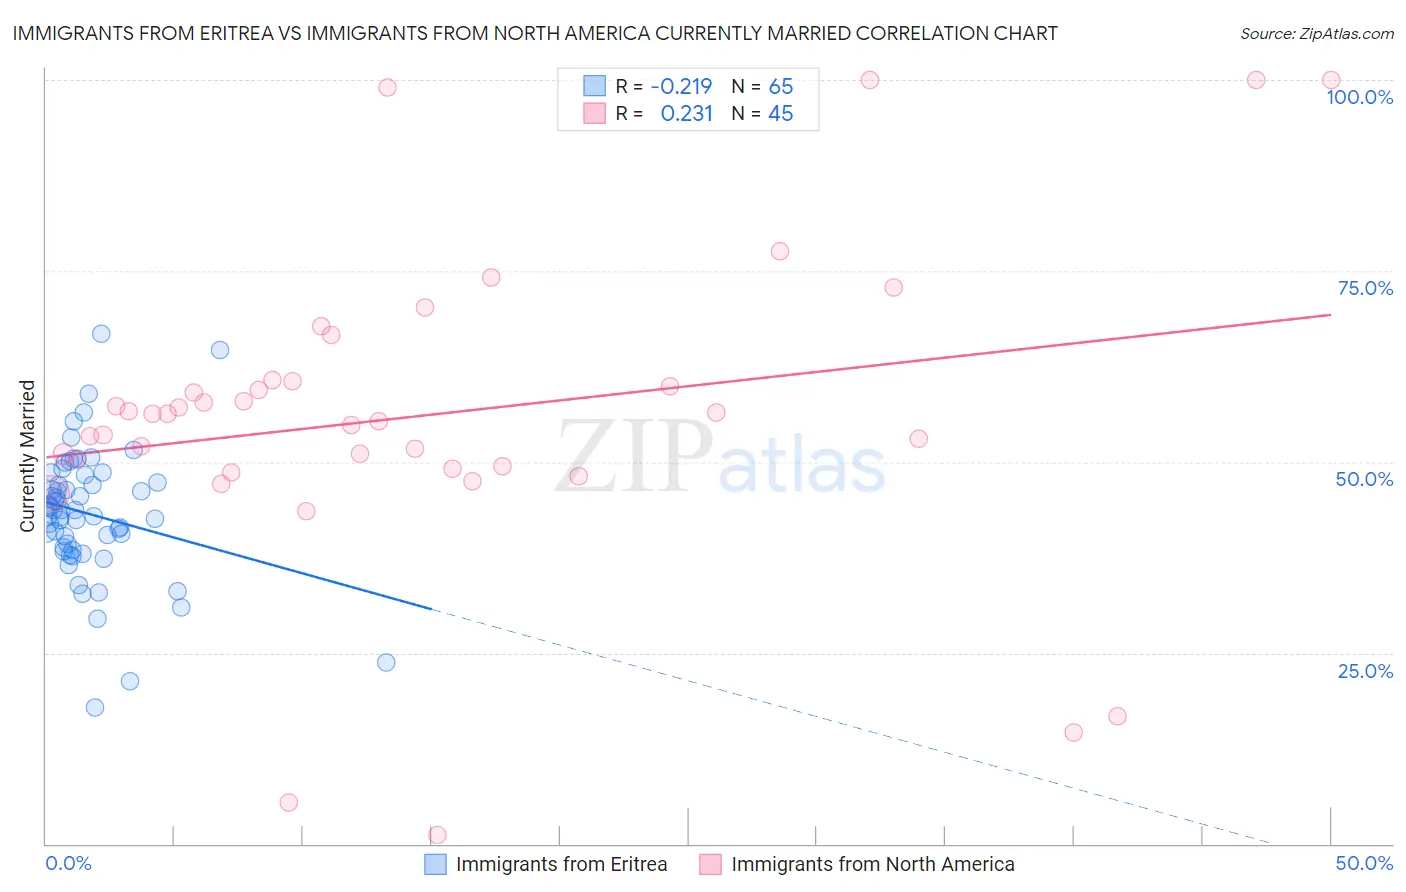
Immigrants from Eritrea vs Immigrants from North America Currently Married Correlation Chart
The statistical analysis conducted on geographies consisting of 104,847,164 people shows a weak negative correlation between the proportion of Immigrants from Eritrea and percentage of population currently married in the United States with a correlation coefficient (R) of -0.219 and weighted average of 43.6%. Similarly, the statistical analysis conducted on geographies consisting of 462,399,389 people shows a weak positive correlation between the proportion of Immigrants from North America and percentage of population currently married in the United States with a correlation coefficient (R) of 0.231 and weighted average of 48.7%, a difference of 11.8%.
Currently Married Correlation Summary
| Measurement | Immigrants from Eritrea | Immigrants from North America |
| Minimum | 17.9% | 1.1% |
| Maximum | 66.7% | 100.0% |
| Range | 48.8% | 98.9% |
| Mean | 43.2% | 56.2% |
| Median | 43.6% | 56.2% |
| Interquartile 25% (IQ1) | 38.6% | 49.3% |
| Interquartile 75% (IQ3) | 47.8% | 60.6% |
| Interquartile Range (IQR) | 9.2% | 11.4% |
| Standard Deviation (Sample) | 8.6% | 20.7% |
| Standard Deviation (Population) | 8.6% | 20.5% |
Similar Demographics by Currently Married
Demographics Similar to Immigrants from Eritrea by Currently Married
In terms of currently married, the demographic groups most similar to Immigrants from Eritrea are Spanish American Indian (43.6%, a difference of 0.0%), Ecuadorian (43.6%, a difference of 0.030%), Immigrants from Bangladesh (43.6%, a difference of 0.10%), Immigrants from Sudan (43.5%, a difference of 0.13%), and Sudanese (43.7%, a difference of 0.18%).
| Demographics | Rating | Rank | Currently Married |
| Immigrants | Latin America | 0.1 /100 | #260 | Tragic 43.8% |
| Immigrants | Nicaragua | 0.1 /100 | #261 | Tragic 43.7% |
| Bangladeshis | 0.1 /100 | #262 | Tragic 43.7% |
| Immigrants | Cuba | 0.1 /100 | #263 | Tragic 43.7% |
| Sudanese | 0.1 /100 | #264 | Tragic 43.7% |
| Immigrants | Bangladesh | 0.1 /100 | #265 | Tragic 43.6% |
| Ecuadorians | 0.1 /100 | #266 | Tragic 43.6% |
| Immigrants | Eritrea | 0.1 /100 | #267 | Tragic 43.6% |
| Spanish American Indians | 0.1 /100 | #268 | Tragic 43.6% |
| Immigrants | Sudan | 0.1 /100 | #269 | Tragic 43.5% |
| Salvadorans | 0.1 /100 | #270 | Tragic 43.5% |
| Bermudans | 0.1 /100 | #271 | Tragic 43.5% |
| Indonesians | 0.1 /100 | #272 | Tragic 43.5% |
| Yaqui | 0.1 /100 | #273 | Tragic 43.4% |
| Nigerians | 0.1 /100 | #274 | Tragic 43.4% |
Demographics Similar to Immigrants from North America by Currently Married
In terms of currently married, the demographic groups most similar to Immigrants from North America are Scotch-Irish (48.7%, a difference of 0.030%), Belgian (48.7%, a difference of 0.030%), Finnish (48.8%, a difference of 0.040%), Immigrants from Iran (48.7%, a difference of 0.060%), and Northern European (48.7%, a difference of 0.060%).
| Demographics | Rating | Rank | Currently Married |
| Hungarians | 99.4 /100 | #37 | Exceptional 48.8% |
| Czechoslovakians | 99.4 /100 | #38 | Exceptional 48.8% |
| British | 99.4 /100 | #39 | Exceptional 48.8% |
| Immigrants | Canada | 99.4 /100 | #40 | Exceptional 48.8% |
| Greeks | 99.3 /100 | #41 | Exceptional 48.8% |
| Finns | 99.3 /100 | #42 | Exceptional 48.8% |
| Scotch-Irish | 99.3 /100 | #43 | Exceptional 48.7% |
| Immigrants | North America | 99.3 /100 | #44 | Exceptional 48.7% |
| Belgians | 99.3 /100 | #45 | Exceptional 48.7% |
| Immigrants | Iran | 99.2 /100 | #46 | Exceptional 48.7% |
| Northern Europeans | 99.2 /100 | #47 | Exceptional 48.7% |
| Austrians | 99.2 /100 | #48 | Exceptional 48.7% |
| Bhutanese | 99.1 /100 | #49 | Exceptional 48.6% |
| Iranians | 99.0 /100 | #50 | Exceptional 48.6% |
| Whites/Caucasians | 99.0 /100 | #51 | Exceptional 48.6% |