Bahamian vs Immigrants from North America Currently Married
COMPARE
Bahamian
Immigrants from North America
Currently Married
Currently Married Comparison
Bahamians
Immigrants from North America
41.2%
CURRENTLY MARRIED
0.0/ 100
METRIC RATING
318th/ 347
METRIC RANK
48.7%
CURRENTLY MARRIED
99.3/ 100
METRIC RATING
44th/ 347
METRIC RANK
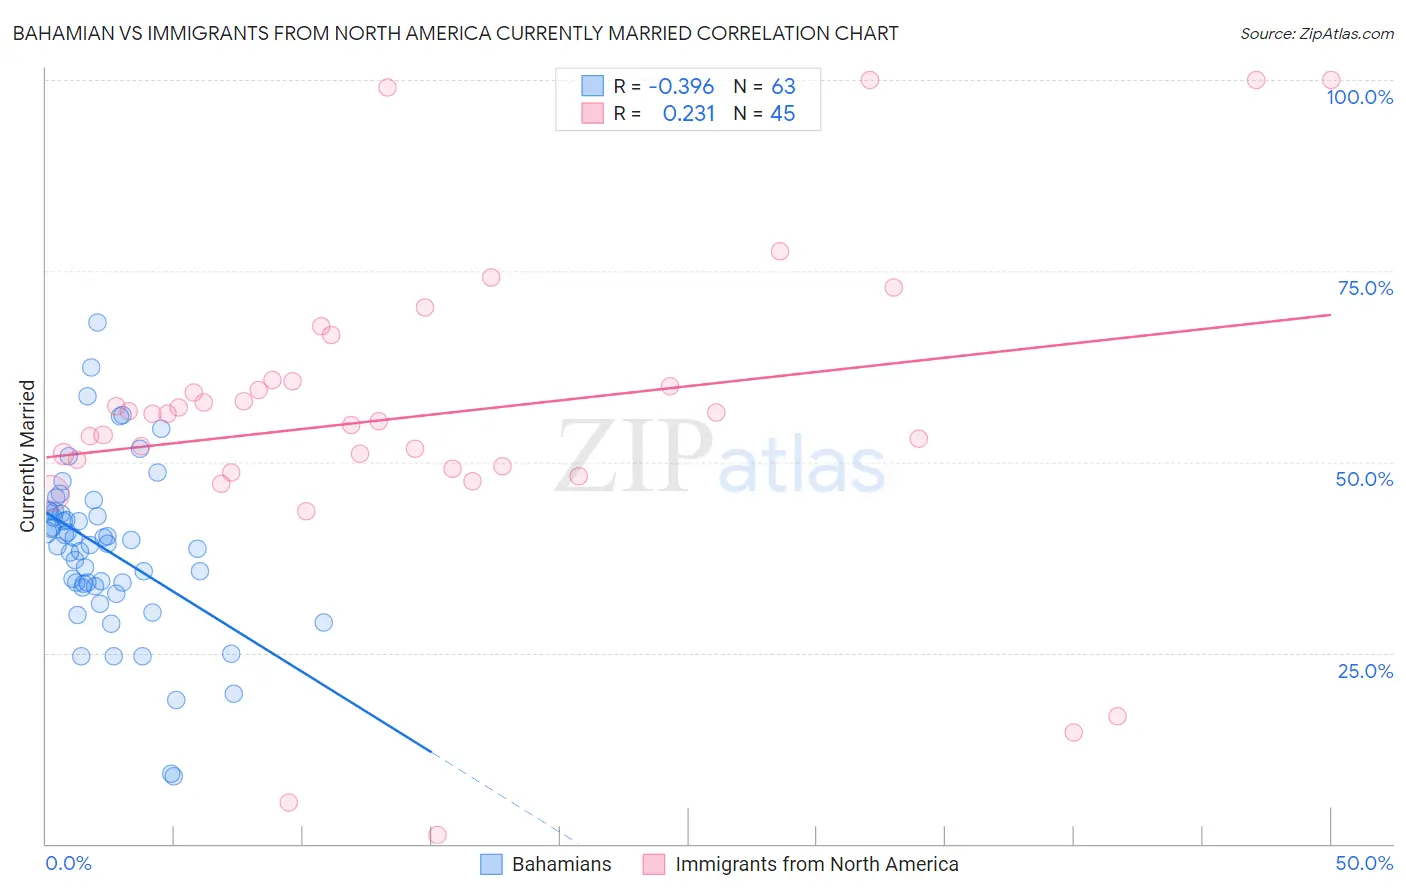
Bahamian vs Immigrants from North America Currently Married Correlation Chart
The statistical analysis conducted on geographies consisting of 112,687,531 people shows a mild negative correlation between the proportion of Bahamians and percentage of population currently married in the United States with a correlation coefficient (R) of -0.396 and weighted average of 41.2%. Similarly, the statistical analysis conducted on geographies consisting of 462,399,389 people shows a weak positive correlation between the proportion of Immigrants from North America and percentage of population currently married in the United States with a correlation coefficient (R) of 0.231 and weighted average of 48.7%, a difference of 18.3%.
Currently Married Correlation Summary
| Measurement | Bahamian | Immigrants from North America |
| Minimum | 8.9% | 1.1% |
| Maximum | 68.3% | 100.0% |
| Range | 59.4% | 98.9% |
| Mean | 38.6% | 56.2% |
| Median | 39.3% | 56.2% |
| Interquartile 25% (IQ1) | 33.7% | 49.3% |
| Interquartile 75% (IQ3) | 43.5% | 60.6% |
| Interquartile Range (IQR) | 9.8% | 11.4% |
| Standard Deviation (Sample) | 10.9% | 20.7% |
| Standard Deviation (Population) | 10.9% | 20.5% |
Similar Demographics by Currently Married
Demographics Similar to Bahamians by Currently Married
In terms of currently married, the demographic groups most similar to Bahamians are Immigrants from Somalia (41.2%, a difference of 0.020%), Immigrants from Jamaica (41.1%, a difference of 0.080%), Haitian (41.3%, a difference of 0.18%), Immigrants from Caribbean (41.3%, a difference of 0.20%), and Inupiat (41.3%, a difference of 0.26%).
| Demographics | Rating | Rank | Currently Married |
| Trinidadians and Tobagonians | 0.0 /100 | #311 | Tragic 41.5% |
| Somalis | 0.0 /100 | #312 | Tragic 41.5% |
| Jamaicans | 0.0 /100 | #313 | Tragic 41.4% |
| West Indians | 0.0 /100 | #314 | Tragic 41.3% |
| Inupiat | 0.0 /100 | #315 | Tragic 41.3% |
| Immigrants | Caribbean | 0.0 /100 | #316 | Tragic 41.3% |
| Haitians | 0.0 /100 | #317 | Tragic 41.3% |
| Bahamians | 0.0 /100 | #318 | Tragic 41.2% |
| Immigrants | Somalia | 0.0 /100 | #319 | Tragic 41.2% |
| Immigrants | Jamaica | 0.0 /100 | #320 | Tragic 41.1% |
| Immigrants | Congo | 0.0 /100 | #321 | Tragic 41.1% |
| Immigrants | Haiti | 0.0 /100 | #322 | Tragic 41.0% |
| Immigrants | West Indies | 0.0 /100 | #323 | Tragic 40.7% |
| Immigrants | Senegal | 0.0 /100 | #324 | Tragic 40.7% |
| U.S. Virgin Islanders | 0.0 /100 | #325 | Tragic 40.7% |
Demographics Similar to Immigrants from North America by Currently Married
In terms of currently married, the demographic groups most similar to Immigrants from North America are Scotch-Irish (48.7%, a difference of 0.030%), Belgian (48.7%, a difference of 0.030%), Finnish (48.8%, a difference of 0.040%), Immigrants from Iran (48.7%, a difference of 0.060%), and Northern European (48.7%, a difference of 0.060%).
| Demographics | Rating | Rank | Currently Married |
| Hungarians | 99.4 /100 | #37 | Exceptional 48.8% |
| Czechoslovakians | 99.4 /100 | #38 | Exceptional 48.8% |
| British | 99.4 /100 | #39 | Exceptional 48.8% |
| Immigrants | Canada | 99.4 /100 | #40 | Exceptional 48.8% |
| Greeks | 99.3 /100 | #41 | Exceptional 48.8% |
| Finns | 99.3 /100 | #42 | Exceptional 48.8% |
| Scotch-Irish | 99.3 /100 | #43 | Exceptional 48.7% |
| Immigrants | North America | 99.3 /100 | #44 | Exceptional 48.7% |
| Belgians | 99.3 /100 | #45 | Exceptional 48.7% |
| Immigrants | Iran | 99.2 /100 | #46 | Exceptional 48.7% |
| Northern Europeans | 99.2 /100 | #47 | Exceptional 48.7% |
| Austrians | 99.2 /100 | #48 | Exceptional 48.7% |
| Bhutanese | 99.1 /100 | #49 | Exceptional 48.6% |
| Iranians | 99.0 /100 | #50 | Exceptional 48.6% |
| Whites/Caucasians | 99.0 /100 | #51 | Exceptional 48.6% |