Guamanian/Chamorro vs Immigrants from Latin America Currently Married
COMPARE
Guamanian/Chamorro
Immigrants from Latin America
Currently Married
Currently Married Comparison
Guamanians/Chamorros
Immigrants from Latin America
47.1%
CURRENTLY MARRIED
74.2/ 100
METRIC RATING
143rd/ 347
METRIC RANK
43.8%
CURRENTLY MARRIED
0.1/ 100
METRIC RATING
260th/ 347
METRIC RANK
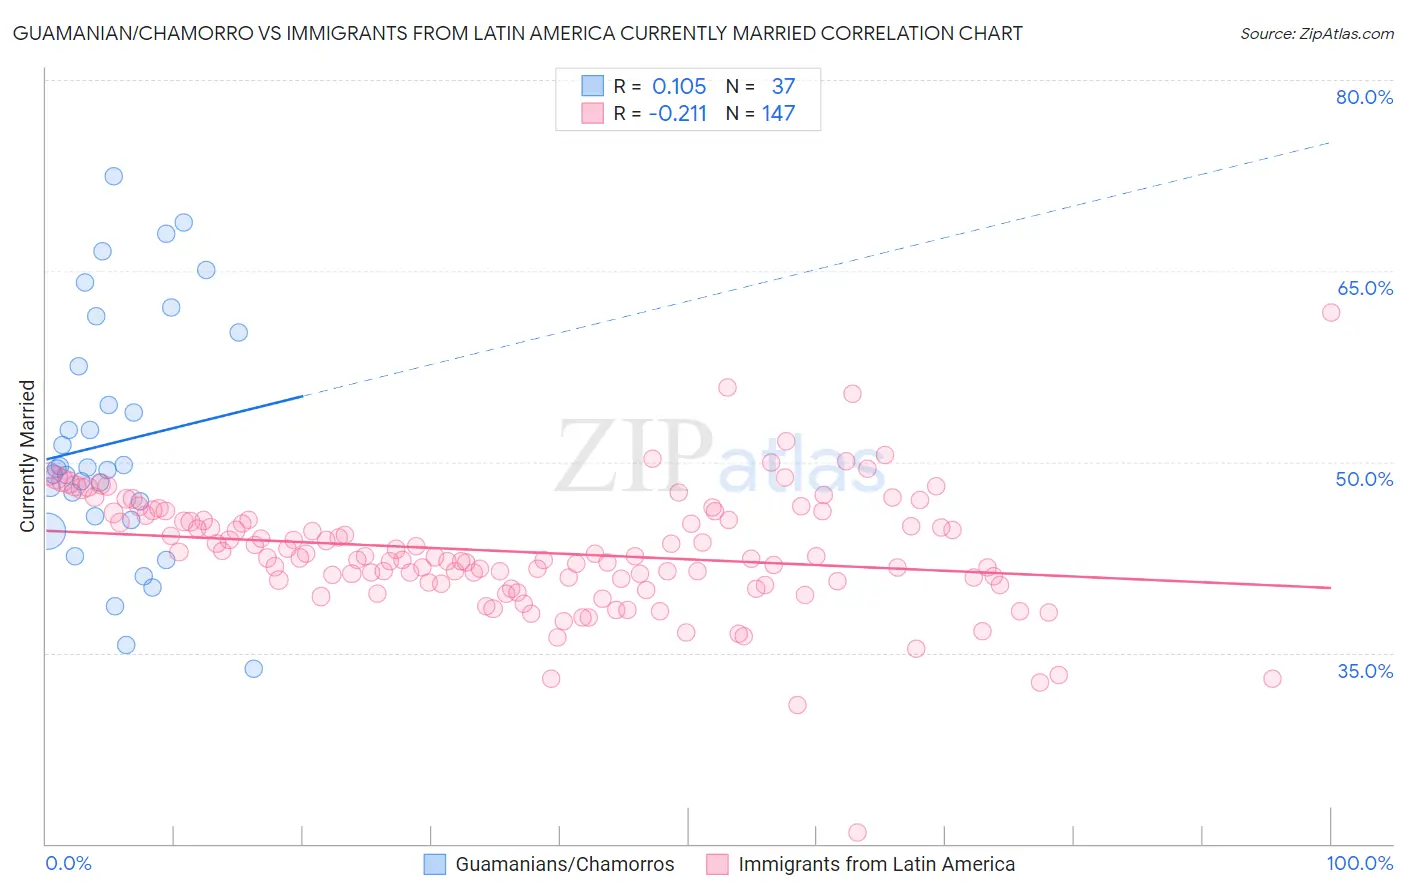
Guamanian/Chamorro vs Immigrants from Latin America Currently Married Correlation Chart
The statistical analysis conducted on geographies consisting of 221,951,395 people shows a poor positive correlation between the proportion of Guamanians/Chamorros and percentage of population currently married in the United States with a correlation coefficient (R) of 0.105 and weighted average of 47.1%. Similarly, the statistical analysis conducted on geographies consisting of 558,538,971 people shows a weak negative correlation between the proportion of Immigrants from Latin America and percentage of population currently married in the United States with a correlation coefficient (R) of -0.211 and weighted average of 43.8%, a difference of 7.6%.
Currently Married Correlation Summary
| Measurement | Guamanian/Chamorro | Immigrants from Latin America |
| Minimum | 33.7% | 20.9% |
| Maximum | 72.4% | 61.8% |
| Range | 38.7% | 40.9% |
| Mean | 51.5% | 42.9% |
| Median | 49.5% | 42.5% |
| Interquartile 25% (IQ1) | 45.6% | 40.6% |
| Interquartile 75% (IQ3) | 58.9% | 45.8% |
| Interquartile Range (IQR) | 13.3% | 5.2% |
| Standard Deviation (Sample) | 9.5% | 4.8% |
| Standard Deviation (Population) | 9.4% | 4.8% |
Similar Demographics by Currently Married
Demographics Similar to Guamanians/Chamorros by Currently Married
In terms of currently married, the demographic groups most similar to Guamanians/Chamorros are Venezuelan (47.1%, a difference of 0.010%), Argentinean (47.1%, a difference of 0.010%), Hmong (47.1%, a difference of 0.040%), Cajun (47.1%, a difference of 0.050%), and Immigrants from South Eastern Asia (47.1%, a difference of 0.060%).
| Demographics | Rating | Rank | Currently Married |
| Immigrants | Vietnam | 78.2 /100 | #136 | Good 47.2% |
| Paraguayans | 77.8 /100 | #137 | Good 47.2% |
| Pakistanis | 77.5 /100 | #138 | Good 47.2% |
| Yugoslavians | 77.4 /100 | #139 | Good 47.2% |
| Cajuns | 75.3 /100 | #140 | Good 47.1% |
| Venezuelans | 74.4 /100 | #141 | Good 47.1% |
| Argentineans | 74.4 /100 | #142 | Good 47.1% |
| Guamanians/Chamorros | 74.2 /100 | #143 | Good 47.1% |
| Hmong | 73.4 /100 | #144 | Good 47.1% |
| Immigrants | South Eastern Asia | 72.9 /100 | #145 | Good 47.1% |
| Carpatho Rusyns | 72.6 /100 | #146 | Good 47.0% |
| Immigrants | Argentina | 72.0 /100 | #147 | Good 47.0% |
| Cambodians | 70.4 /100 | #148 | Good 47.0% |
| Zimbabweans | 70.1 /100 | #149 | Good 47.0% |
| Immigrants | Turkey | 70.0 /100 | #150 | Good 47.0% |
Demographics Similar to Immigrants from Latin America by Currently Married
In terms of currently married, the demographic groups most similar to Immigrants from Latin America are Immigrants from Nicaragua (43.7%, a difference of 0.040%), Immigrants from Sierra Leone (43.8%, a difference of 0.060%), Bangladeshi (43.7%, a difference of 0.18%), Immigrants from Cuba (43.7%, a difference of 0.22%), and Sudanese (43.7%, a difference of 0.24%).
| Demographics | Rating | Rank | Currently Married |
| Immigrants | Central America | 0.3 /100 | #253 | Tragic 44.1% |
| Vietnamese | 0.2 /100 | #254 | Tragic 44.0% |
| Yakama | 0.2 /100 | #255 | Tragic 44.0% |
| Shoshone | 0.2 /100 | #256 | Tragic 44.0% |
| Immigrants | Africa | 0.2 /100 | #257 | Tragic 43.9% |
| Ute | 0.2 /100 | #258 | Tragic 43.9% |
| Immigrants | Sierra Leone | 0.1 /100 | #259 | Tragic 43.8% |
| Immigrants | Latin America | 0.1 /100 | #260 | Tragic 43.8% |
| Immigrants | Nicaragua | 0.1 /100 | #261 | Tragic 43.7% |
| Bangladeshis | 0.1 /100 | #262 | Tragic 43.7% |
| Immigrants | Cuba | 0.1 /100 | #263 | Tragic 43.7% |
| Sudanese | 0.1 /100 | #264 | Tragic 43.7% |
| Immigrants | Bangladesh | 0.1 /100 | #265 | Tragic 43.6% |
| Ecuadorians | 0.1 /100 | #266 | Tragic 43.6% |
| Immigrants | Eritrea | 0.1 /100 | #267 | Tragic 43.6% |