Marshallese vs Immigrants from Latin America Currently Married
COMPARE
Marshallese
Immigrants from Latin America
Currently Married
Currently Married Comparison
Marshallese
Immigrants from Latin America
45.5%
CURRENTLY MARRIED
7.2/ 100
METRIC RATING
212th/ 347
METRIC RANK
43.8%
CURRENTLY MARRIED
0.1/ 100
METRIC RATING
260th/ 347
METRIC RANK
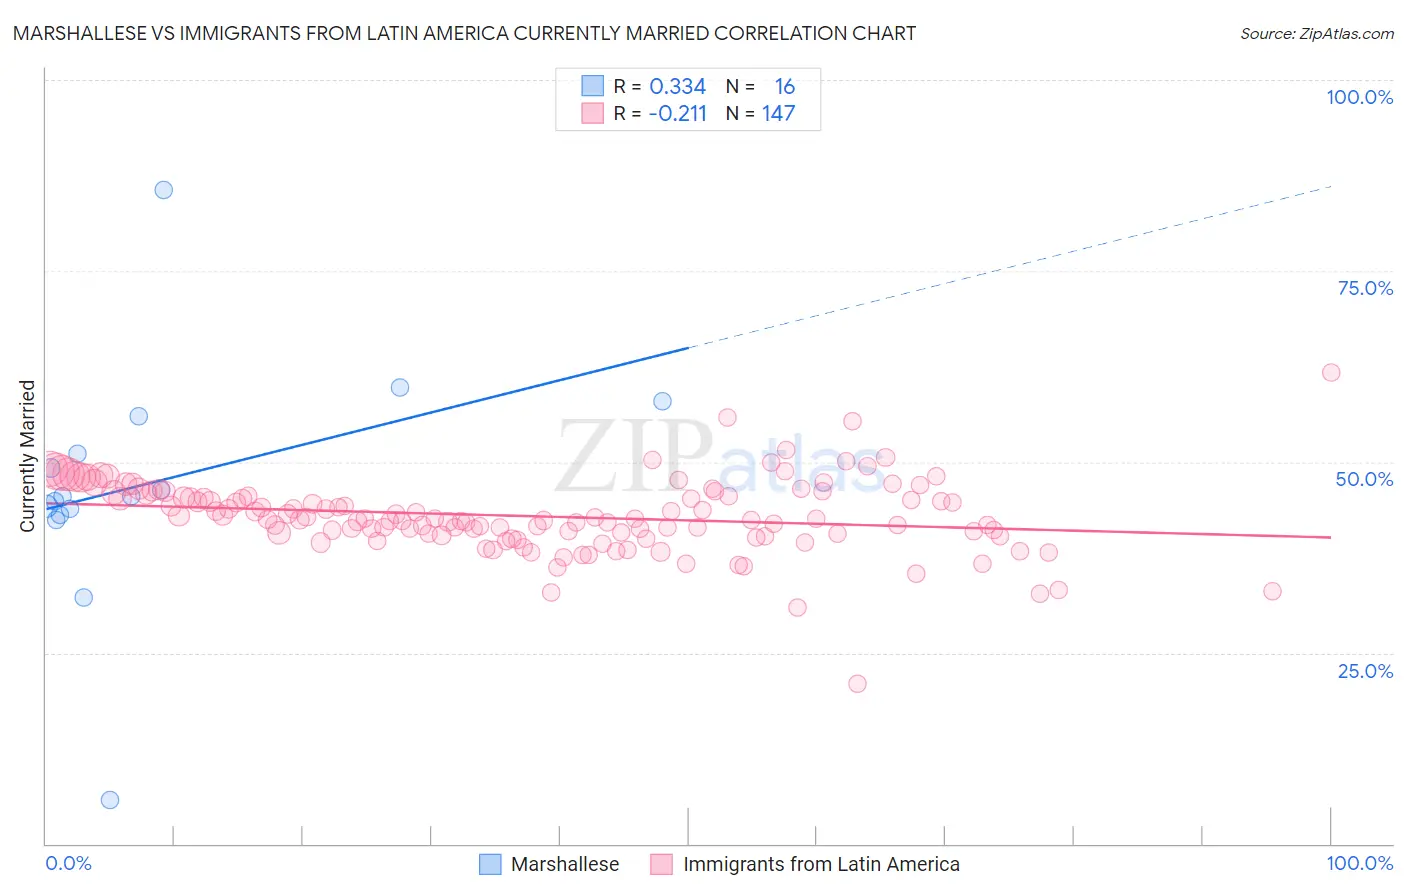
Marshallese vs Immigrants from Latin America Currently Married Correlation Chart
The statistical analysis conducted on geographies consisting of 14,761,315 people shows a mild positive correlation between the proportion of Marshallese and percentage of population currently married in the United States with a correlation coefficient (R) of 0.334 and weighted average of 45.5%. Similarly, the statistical analysis conducted on geographies consisting of 558,538,971 people shows a weak negative correlation between the proportion of Immigrants from Latin America and percentage of population currently married in the United States with a correlation coefficient (R) of -0.211 and weighted average of 43.8%, a difference of 4.1%.
Currently Married Correlation Summary
| Measurement | Marshallese | Immigrants from Latin America |
| Minimum | 5.8% | 20.9% |
| Maximum | 85.6% | 61.8% |
| Range | 79.8% | 40.9% |
| Mean | 47.1% | 42.9% |
| Median | 45.5% | 42.5% |
| Interquartile 25% (IQ1) | 43.5% | 40.6% |
| Interquartile 75% (IQ3) | 53.5% | 45.8% |
| Interquartile Range (IQR) | 10.0% | 5.2% |
| Standard Deviation (Sample) | 16.0% | 4.8% |
| Standard Deviation (Population) | 15.5% | 4.8% |
Similar Demographics by Currently Married
Demographics Similar to Marshallese by Currently Married
In terms of currently married, the demographic groups most similar to Marshallese are Houma (45.5%, a difference of 0.010%), Alaska Native (45.5%, a difference of 0.030%), Dutch West Indian (45.5%, a difference of 0.070%), German Russian (45.5%, a difference of 0.070%), and Uruguayan (45.6%, a difference of 0.090%).
| Demographics | Rating | Rank | Currently Married |
| South American Indians | 11.5 /100 | #205 | Poor 45.8% |
| Immigrants | Immigrants | 11.2 /100 | #206 | Poor 45.8% |
| Immigrants | South America | 10.8 /100 | #207 | Poor 45.7% |
| Alsatians | 10.8 /100 | #208 | Poor 45.7% |
| Immigrants | Micronesia | 8.8 /100 | #209 | Tragic 45.6% |
| Uruguayans | 7.9 /100 | #210 | Tragic 45.6% |
| Houma | 7.2 /100 | #211 | Tragic 45.5% |
| Marshallese | 7.2 /100 | #212 | Tragic 45.5% |
| Alaska Natives | 7.0 /100 | #213 | Tragic 45.5% |
| Dutch West Indians | 6.7 /100 | #214 | Tragic 45.5% |
| German Russians | 6.7 /100 | #215 | Tragic 45.5% |
| Immigrants | Morocco | 5.5 /100 | #216 | Tragic 45.4% |
| Immigrants | Thailand | 5.1 /100 | #217 | Tragic 45.4% |
| Panamanians | 4.0 /100 | #218 | Tragic 45.3% |
| Immigrants | Portugal | 3.5 /100 | #219 | Tragic 45.2% |
Demographics Similar to Immigrants from Latin America by Currently Married
In terms of currently married, the demographic groups most similar to Immigrants from Latin America are Immigrants from Nicaragua (43.7%, a difference of 0.040%), Immigrants from Sierra Leone (43.8%, a difference of 0.060%), Bangladeshi (43.7%, a difference of 0.18%), Immigrants from Cuba (43.7%, a difference of 0.22%), and Sudanese (43.7%, a difference of 0.24%).
| Demographics | Rating | Rank | Currently Married |
| Immigrants | Central America | 0.3 /100 | #253 | Tragic 44.1% |
| Vietnamese | 0.2 /100 | #254 | Tragic 44.0% |
| Yakama | 0.2 /100 | #255 | Tragic 44.0% |
| Shoshone | 0.2 /100 | #256 | Tragic 44.0% |
| Immigrants | Africa | 0.2 /100 | #257 | Tragic 43.9% |
| Ute | 0.2 /100 | #258 | Tragic 43.9% |
| Immigrants | Sierra Leone | 0.1 /100 | #259 | Tragic 43.8% |
| Immigrants | Latin America | 0.1 /100 | #260 | Tragic 43.8% |
| Immigrants | Nicaragua | 0.1 /100 | #261 | Tragic 43.7% |
| Bangladeshis | 0.1 /100 | #262 | Tragic 43.7% |
| Immigrants | Cuba | 0.1 /100 | #263 | Tragic 43.7% |
| Sudanese | 0.1 /100 | #264 | Tragic 43.7% |
| Immigrants | Bangladesh | 0.1 /100 | #265 | Tragic 43.6% |
| Ecuadorians | 0.1 /100 | #266 | Tragic 43.6% |
| Immigrants | Eritrea | 0.1 /100 | #267 | Tragic 43.6% |