Albanian vs Immigrants from Latin America Currently Married
COMPARE
Albanian
Immigrants from Latin America
Currently Married
Currently Married Comparison
Albanians
Immigrants from Latin America
47.0%
CURRENTLY MARRIED
68.6/ 100
METRIC RATING
154th/ 347
METRIC RANK
43.8%
CURRENTLY MARRIED
0.1/ 100
METRIC RATING
260th/ 347
METRIC RANK
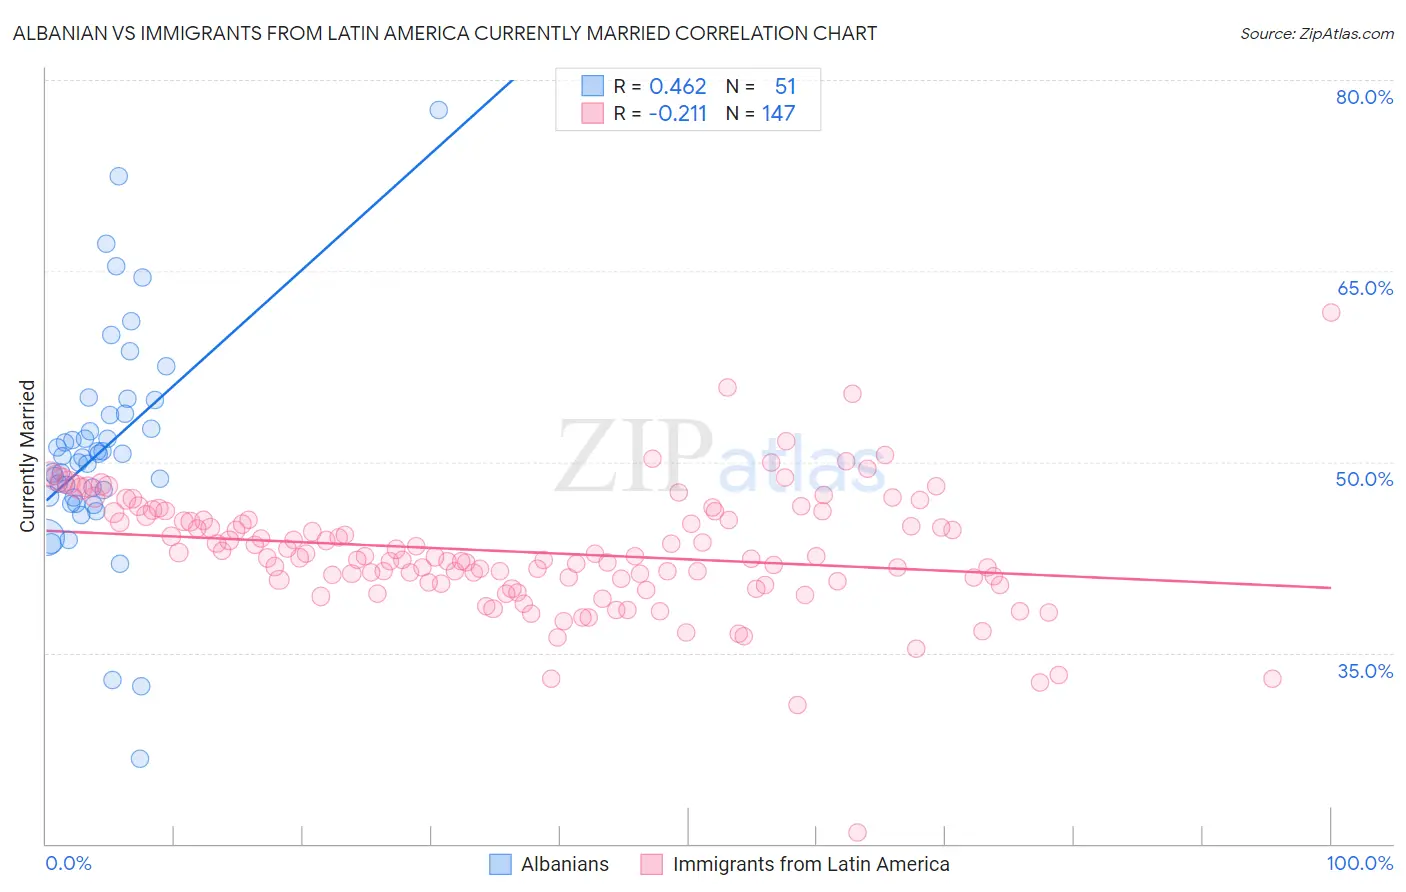
Albanian vs Immigrants from Latin America Currently Married Correlation Chart
The statistical analysis conducted on geographies consisting of 193,235,745 people shows a moderate positive correlation between the proportion of Albanians and percentage of population currently married in the United States with a correlation coefficient (R) of 0.462 and weighted average of 47.0%. Similarly, the statistical analysis conducted on geographies consisting of 558,538,971 people shows a weak negative correlation between the proportion of Immigrants from Latin America and percentage of population currently married in the United States with a correlation coefficient (R) of -0.211 and weighted average of 43.8%, a difference of 7.3%.
Currently Married Correlation Summary
| Measurement | Albanian | Immigrants from Latin America |
| Minimum | 26.7% | 20.9% |
| Maximum | 77.6% | 61.8% |
| Range | 50.9% | 40.9% |
| Mean | 51.0% | 42.9% |
| Median | 50.5% | 42.5% |
| Interquartile 25% (IQ1) | 47.2% | 40.6% |
| Interquartile 75% (IQ3) | 53.7% | 45.8% |
| Interquartile Range (IQR) | 6.5% | 5.2% |
| Standard Deviation (Sample) | 8.8% | 4.8% |
| Standard Deviation (Population) | 8.7% | 4.8% |
Similar Demographics by Currently Married
Demographics Similar to Albanians by Currently Married
In terms of currently married, the demographic groups most similar to Albanians are Immigrants from Venezuela (47.0%, a difference of 0.0%), Arab (47.0%, a difference of 0.0%), Immigrants from Serbia (47.0%, a difference of 0.010%), Spanish (47.0%, a difference of 0.020%), and Immigrants from Switzerland (46.9%, a difference of 0.030%).
| Demographics | Rating | Rank | Currently Married |
| Immigrants | Argentina | 72.0 /100 | #147 | Good 47.0% |
| Cambodians | 70.4 /100 | #148 | Good 47.0% |
| Zimbabweans | 70.1 /100 | #149 | Good 47.0% |
| Immigrants | Turkey | 70.0 /100 | #150 | Good 47.0% |
| Chileans | 69.8 /100 | #151 | Good 47.0% |
| Immigrants | Serbia | 68.8 /100 | #152 | Good 47.0% |
| Immigrants | Venezuela | 68.6 /100 | #153 | Good 47.0% |
| Albanians | 68.6 /100 | #154 | Good 47.0% |
| Arabs | 68.6 /100 | #155 | Good 47.0% |
| Spanish | 68.1 /100 | #156 | Good 47.0% |
| Immigrants | Switzerland | 67.8 /100 | #157 | Good 46.9% |
| Cherokee | 66.8 /100 | #158 | Good 46.9% |
| Iraqis | 66.4 /100 | #159 | Good 46.9% |
| Immigrants | Uzbekistan | 66.0 /100 | #160 | Good 46.9% |
| Immigrants | Southern Europe | 65.9 /100 | #161 | Good 46.9% |
Demographics Similar to Immigrants from Latin America by Currently Married
In terms of currently married, the demographic groups most similar to Immigrants from Latin America are Immigrants from Nicaragua (43.7%, a difference of 0.040%), Immigrants from Sierra Leone (43.8%, a difference of 0.060%), Bangladeshi (43.7%, a difference of 0.18%), Immigrants from Cuba (43.7%, a difference of 0.22%), and Sudanese (43.7%, a difference of 0.24%).
| Demographics | Rating | Rank | Currently Married |
| Immigrants | Central America | 0.3 /100 | #253 | Tragic 44.1% |
| Vietnamese | 0.2 /100 | #254 | Tragic 44.0% |
| Yakama | 0.2 /100 | #255 | Tragic 44.0% |
| Shoshone | 0.2 /100 | #256 | Tragic 44.0% |
| Immigrants | Africa | 0.2 /100 | #257 | Tragic 43.9% |
| Ute | 0.2 /100 | #258 | Tragic 43.9% |
| Immigrants | Sierra Leone | 0.1 /100 | #259 | Tragic 43.8% |
| Immigrants | Latin America | 0.1 /100 | #260 | Tragic 43.8% |
| Immigrants | Nicaragua | 0.1 /100 | #261 | Tragic 43.7% |
| Bangladeshis | 0.1 /100 | #262 | Tragic 43.7% |
| Immigrants | Cuba | 0.1 /100 | #263 | Tragic 43.7% |
| Sudanese | 0.1 /100 | #264 | Tragic 43.7% |
| Immigrants | Bangladesh | 0.1 /100 | #265 | Tragic 43.6% |
| Ecuadorians | 0.1 /100 | #266 | Tragic 43.6% |
| Immigrants | Eritrea | 0.1 /100 | #267 | Tragic 43.6% |