Delaware vs Czechoslovakian Unemployment Among Seniors over 65 years
COMPARE
Delaware
Czechoslovakian
Unemployment Among Seniors over 65 years
Unemployment Among Seniors over 65 years Comparison
Delaware
Czechoslovakians
5.7%
UNEMPLOYMENT AMONG SENIORS OVER 65 YEARS
0.0/ 100
METRIC RATING
314th/ 347
METRIC RANK
5.0%
UNEMPLOYMENT AMONG SENIORS OVER 65 YEARS
96.7/ 100
METRIC RATING
98th/ 347
METRIC RANK
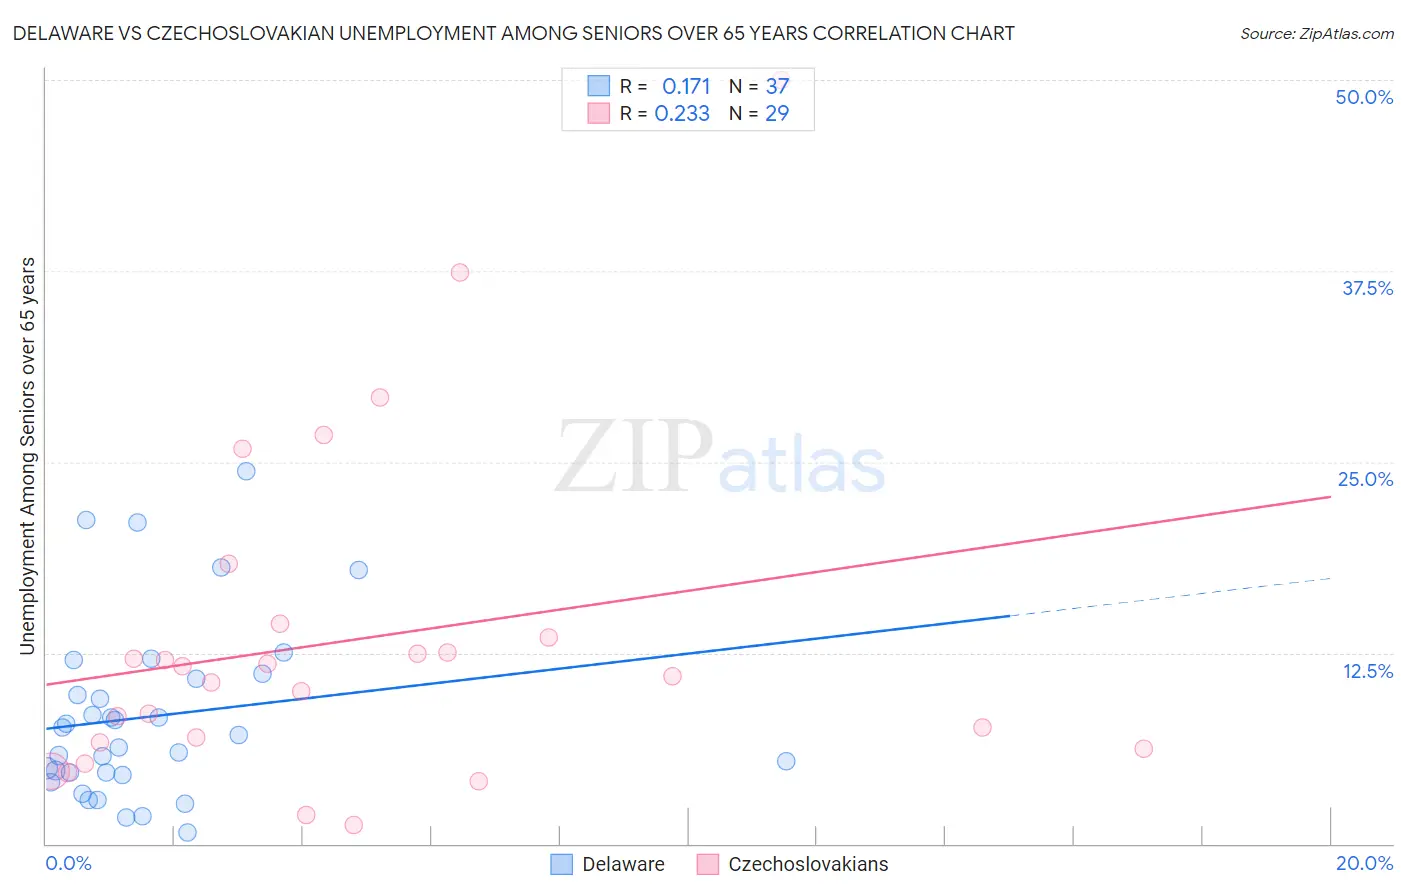
Delaware vs Czechoslovakian Unemployment Among Seniors over 65 years Correlation Chart
The statistical analysis conducted on geographies consisting of 91,321,355 people shows a poor positive correlation between the proportion of Delaware and unemployment rate amomg seniors over the age of 65 in the United States with a correlation coefficient (R) of 0.171 and weighted average of 5.7%. Similarly, the statistical analysis conducted on geographies consisting of 328,703,757 people shows a weak positive correlation between the proportion of Czechoslovakians and unemployment rate amomg seniors over the age of 65 in the United States with a correlation coefficient (R) of 0.233 and weighted average of 5.0%, a difference of 13.2%.
Unemployment Among Seniors over 65 years Correlation Summary
| Measurement | Delaware | Czechoslovakian |
| Minimum | 0.70% | 1.2% |
| Maximum | 24.4% | 50.0% |
| Range | 23.7% | 48.8% |
| Mean | 8.3% | 13.3% |
| Median | 7.1% | 11.0% |
| Interquartile 25% (IQ1) | 4.6% | 6.4% |
| Interquartile 75% (IQ3) | 11.0% | 14.0% |
| Interquartile Range (IQR) | 6.4% | 7.5% |
| Standard Deviation (Sample) | 5.8% | 11.0% |
| Standard Deviation (Population) | 5.7% | 10.8% |
Similar Demographics by Unemployment Among Seniors over 65 years
Demographics Similar to Delaware by Unemployment Among Seniors over 65 years
In terms of unemployment among seniors over 65 years, the demographic groups most similar to Delaware are Immigrants from El Salvador (5.7%, a difference of 0.030%), Immigrants from Central America (5.7%, a difference of 0.22%), Immigrants from Bahamas (5.7%, a difference of 0.34%), Barbadian (5.6%, a difference of 0.52%), and Immigrants from Ecuador (5.6%, a difference of 0.55%).
| Demographics | Rating | Rank | Unemployment Among Seniors over 65 years |
| Portuguese | 0.0 /100 | #307 | Tragic 5.6% |
| Immigrants | St. Vincent and the Grenadines | 0.0 /100 | #308 | Tragic 5.6% |
| Immigrants | Guatemala | 0.0 /100 | #309 | Tragic 5.6% |
| Salvadorans | 0.0 /100 | #310 | Tragic 5.6% |
| Immigrants | Guyana | 0.0 /100 | #311 | Tragic 5.6% |
| Immigrants | Ecuador | 0.0 /100 | #312 | Tragic 5.6% |
| Barbadians | 0.0 /100 | #313 | Tragic 5.6% |
| Delaware | 0.0 /100 | #314 | Tragic 5.7% |
| Immigrants | El Salvador | 0.0 /100 | #315 | Tragic 5.7% |
| Immigrants | Central America | 0.0 /100 | #316 | Tragic 5.7% |
| Immigrants | Bahamas | 0.0 /100 | #317 | Tragic 5.7% |
| Vietnamese | 0.0 /100 | #318 | Tragic 5.7% |
| Immigrants | Bangladesh | 0.0 /100 | #319 | Tragic 5.7% |
| Immigrants | Mexico | 0.0 /100 | #320 | Tragic 5.7% |
| British West Indians | 0.0 /100 | #321 | Tragic 5.8% |
Demographics Similar to Czechoslovakians by Unemployment Among Seniors over 65 years
In terms of unemployment among seniors over 65 years, the demographic groups most similar to Czechoslovakians are Assyrian/Chaldean/Syriac (5.0%, a difference of 0.010%), Immigrants from Singapore (5.0%, a difference of 0.010%), Immigrants from Oceania (5.0%, a difference of 0.010%), Burmese (5.0%, a difference of 0.030%), and South African (5.0%, a difference of 0.050%).
| Demographics | Rating | Rank | Unemployment Among Seniors over 65 years |
| Immigrants | Bolivia | 97.3 /100 | #91 | Exceptional 5.0% |
| Immigrants | Bulgaria | 97.3 /100 | #92 | Exceptional 5.0% |
| Austrians | 97.3 /100 | #93 | Exceptional 5.0% |
| Burmese | 96.8 /100 | #94 | Exceptional 5.0% |
| Assyrians/Chaldeans/Syriacs | 96.8 /100 | #95 | Exceptional 5.0% |
| Immigrants | Singapore | 96.8 /100 | #96 | Exceptional 5.0% |
| Immigrants | Oceania | 96.8 /100 | #97 | Exceptional 5.0% |
| Czechoslovakians | 96.7 /100 | #98 | Exceptional 5.0% |
| South Africans | 96.5 /100 | #99 | Exceptional 5.0% |
| Romanians | 95.5 /100 | #100 | Exceptional 5.0% |
| Yugoslavians | 95.4 /100 | #101 | Exceptional 5.0% |
| Immigrants | Thailand | 95.4 /100 | #102 | Exceptional 5.0% |
| Immigrants | Lithuania | 95.1 /100 | #103 | Exceptional 5.0% |
| Immigrants | Scotland | 95.0 /100 | #104 | Exceptional 5.0% |
| Okinawans | 94.7 /100 | #105 | Exceptional 5.0% |