Immigrants from Northern Europe vs Czechoslovakian Average Family Size
COMPARE
Immigrants from Northern Europe
Czechoslovakian
Average Family Size
Average Family Size Comparison
Immigrants from Northern Europe
Czechoslovakians
3.13
AVERAGE FAMILY SIZE
0.1/ 100
METRIC RATING
311th/ 347
METRIC RANK
3.13
AVERAGE FAMILY SIZE
0.1/ 100
METRIC RATING
310th/ 347
METRIC RANK
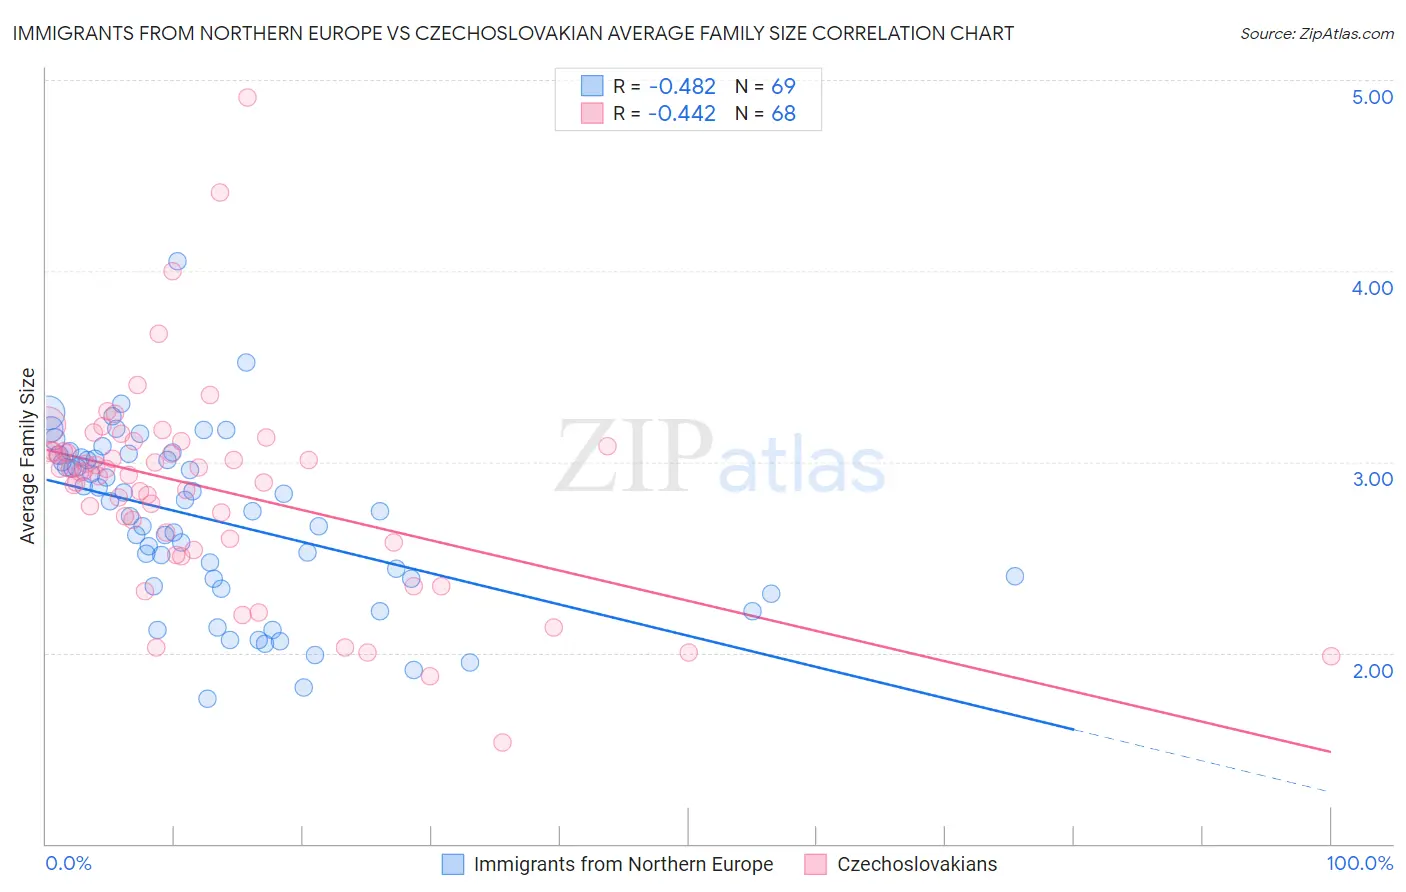
Immigrants from Northern Europe vs Czechoslovakian Average Family Size Correlation Chart
The statistical analysis conducted on geographies consisting of 476,950,566 people shows a moderate negative correlation between the proportion of Immigrants from Northern Europe and average family size in the United States with a correlation coefficient (R) of -0.482 and weighted average of 3.13. Similarly, the statistical analysis conducted on geographies consisting of 368,525,385 people shows a moderate negative correlation between the proportion of Czechoslovakians and average family size in the United States with a correlation coefficient (R) of -0.442 and weighted average of 3.13, a difference of 0.040%.
Average Family Size Correlation Summary
| Measurement | Immigrants from Northern Europe | Czechoslovakian |
| Minimum | 1.76 | 1.53 |
| Maximum | 4.05 | 4.91 |
| Range | 2.29 | 3.38 |
| Mean | 2.69 | 2.86 |
| Median | 2.74 | 2.95 |
| Interquartile 25% (IQ1) | 2.37 | 2.59 |
| Interquartile 75% (IQ3) | 3.02 | 3.07 |
| Interquartile Range (IQR) | 0.65 | 0.48 |
| Standard Deviation (Sample) | 0.45 | 0.54 |
| Standard Deviation (Population) | 0.45 | 0.54 |
Demographics Similar to Immigrants from Northern Europe and Czechoslovakians by Average Family Size
In terms of average family size, the demographic groups most similar to Immigrants from Northern Europe are Immigrants from Australia (3.13, a difference of 0.020%), Bulgarian (3.13, a difference of 0.030%), Northern European (3.13, a difference of 0.060%), Slavic (3.13, a difference of 0.070%), and Russian (3.12, a difference of 0.070%). Similarly, the demographic groups most similar to Czechoslovakians are Northern European (3.13, a difference of 0.020%), Slavic (3.13, a difference of 0.030%), Immigrants from Australia (3.13, a difference of 0.060%), Bulgarian (3.13, a difference of 0.070%), and Immigrants from Serbia (3.13, a difference of 0.080%).
| Demographics | Rating | Rank | Average Family Size |
| Immigrants | Sweden | 0.2 /100 | #300 | Tragic 3.14 |
| Macedonians | 0.2 /100 | #301 | Tragic 3.13 |
| Immigrants | Latvia | 0.2 /100 | #302 | Tragic 3.13 |
| British | 0.2 /100 | #303 | Tragic 3.13 |
| Immigrants | Switzerland | 0.2 /100 | #304 | Tragic 3.13 |
| Australians | 0.1 /100 | #305 | Tragic 3.13 |
| Immigrants | Ireland | 0.1 /100 | #306 | Tragic 3.13 |
| Immigrants | Serbia | 0.1 /100 | #307 | Tragic 3.13 |
| Slavs | 0.1 /100 | #308 | Tragic 3.13 |
| Northern Europeans | 0.1 /100 | #309 | Tragic 3.13 |
| Czechoslovakians | 0.1 /100 | #310 | Tragic 3.13 |
| Immigrants | Northern Europe | 0.1 /100 | #311 | Tragic 3.13 |
| Immigrants | Australia | 0.1 /100 | #312 | Tragic 3.13 |
| Bulgarians | 0.1 /100 | #313 | Tragic 3.13 |
| Russians | 0.1 /100 | #314 | Tragic 3.12 |
| Immigrants | Scotland | 0.1 /100 | #315 | Tragic 3.12 |
| Serbians | 0.1 /100 | #316 | Tragic 3.12 |
| Italians | 0.1 /100 | #317 | Tragic 3.12 |
| Eastern Europeans | 0.1 /100 | #318 | Tragic 3.12 |
| Welsh | 0.1 /100 | #319 | Tragic 3.12 |
| Immigrants | North America | 0.0 /100 | #320 | Tragic 3.12 |