Immigrants from Western Europe vs Czechoslovakian Average Family Size
COMPARE
Immigrants from Western Europe
Czechoslovakian
Average Family Size
Average Family Size Comparison
Immigrants from Western Europe
Czechoslovakians
3.14
AVERAGE FAMILY SIZE
0.2/ 100
METRIC RATING
297th/ 347
METRIC RANK
3.13
AVERAGE FAMILY SIZE
0.1/ 100
METRIC RATING
310th/ 347
METRIC RANK
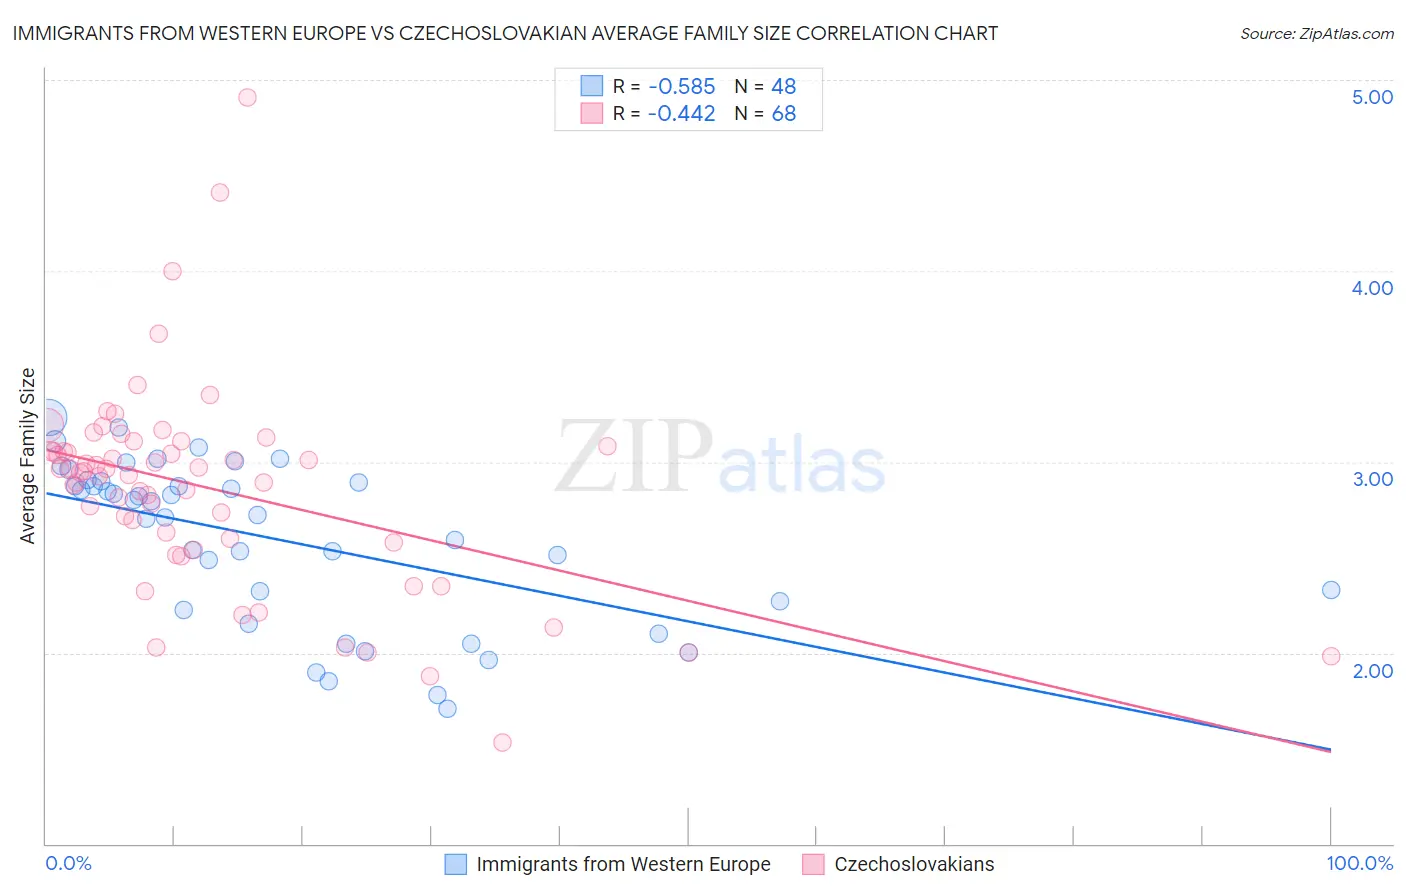
Immigrants from Western Europe vs Czechoslovakian Average Family Size Correlation Chart
The statistical analysis conducted on geographies consisting of 493,828,171 people shows a substantial negative correlation between the proportion of Immigrants from Western Europe and average family size in the United States with a correlation coefficient (R) of -0.585 and weighted average of 3.14. Similarly, the statistical analysis conducted on geographies consisting of 368,525,385 people shows a moderate negative correlation between the proportion of Czechoslovakians and average family size in the United States with a correlation coefficient (R) of -0.442 and weighted average of 3.13, a difference of 0.34%.
Average Family Size Correlation Summary
| Measurement | Immigrants from Western Europe | Czechoslovakian |
| Minimum | 1.71 | 1.53 |
| Maximum | 3.23 | 4.91 |
| Range | 1.52 | 3.38 |
| Mean | 2.59 | 2.86 |
| Median | 2.76 | 2.95 |
| Interquartile 25% (IQ1) | 2.25 | 2.59 |
| Interquartile 75% (IQ3) | 2.89 | 3.07 |
| Interquartile Range (IQR) | 0.65 | 0.48 |
| Standard Deviation (Sample) | 0.42 | 0.54 |
| Standard Deviation (Population) | 0.41 | 0.54 |
Demographics Similar to Immigrants from Western Europe and Czechoslovakians by Average Family Size
In terms of average family size, the demographic groups most similar to Immigrants from Western Europe are Austrian (3.14, a difference of 0.0%), Ukrainian (3.14, a difference of 0.0%), Colville (3.14, a difference of 0.0%), Immigrants from Croatia (3.14, a difference of 0.010%), and Scandinavian (3.14, a difference of 0.030%). Similarly, the demographic groups most similar to Czechoslovakians are Northern European (3.13, a difference of 0.020%), Slavic (3.13, a difference of 0.030%), Immigrants from Northern Europe (3.13, a difference of 0.040%), Immigrants from Australia (3.13, a difference of 0.060%), and Bulgarian (3.13, a difference of 0.070%).
| Demographics | Rating | Rank | Average Family Size |
| Scandinavians | 0.2 /100 | #293 | Tragic 3.14 |
| Immigrants | Croatia | 0.2 /100 | #294 | Tragic 3.14 |
| Austrians | 0.2 /100 | #295 | Tragic 3.14 |
| Ukrainians | 0.2 /100 | #296 | Tragic 3.14 |
| Immigrants | Western Europe | 0.2 /100 | #297 | Tragic 3.14 |
| Colville | 0.2 /100 | #298 | Tragic 3.14 |
| Canadians | 0.2 /100 | #299 | Tragic 3.14 |
| Immigrants | Sweden | 0.2 /100 | #300 | Tragic 3.14 |
| Macedonians | 0.2 /100 | #301 | Tragic 3.13 |
| Immigrants | Latvia | 0.2 /100 | #302 | Tragic 3.13 |
| British | 0.2 /100 | #303 | Tragic 3.13 |
| Immigrants | Switzerland | 0.2 /100 | #304 | Tragic 3.13 |
| Australians | 0.1 /100 | #305 | Tragic 3.13 |
| Immigrants | Ireland | 0.1 /100 | #306 | Tragic 3.13 |
| Immigrants | Serbia | 0.1 /100 | #307 | Tragic 3.13 |
| Slavs | 0.1 /100 | #308 | Tragic 3.13 |
| Northern Europeans | 0.1 /100 | #309 | Tragic 3.13 |
| Czechoslovakians | 0.1 /100 | #310 | Tragic 3.13 |
| Immigrants | Northern Europe | 0.1 /100 | #311 | Tragic 3.13 |
| Immigrants | Australia | 0.1 /100 | #312 | Tragic 3.13 |
| Bulgarians | 0.1 /100 | #313 | Tragic 3.13 |