Danish vs Czechoslovakian Average Family Size
COMPARE
Danish
Czechoslovakian
Average Family Size
Average Family Size Comparison
Danes
Czechoslovakians
3.17
AVERAGE FAMILY SIZE
2.5/ 100
METRIC RATING
246th/ 347
METRIC RANK
3.13
AVERAGE FAMILY SIZE
0.1/ 100
METRIC RATING
310th/ 347
METRIC RANK
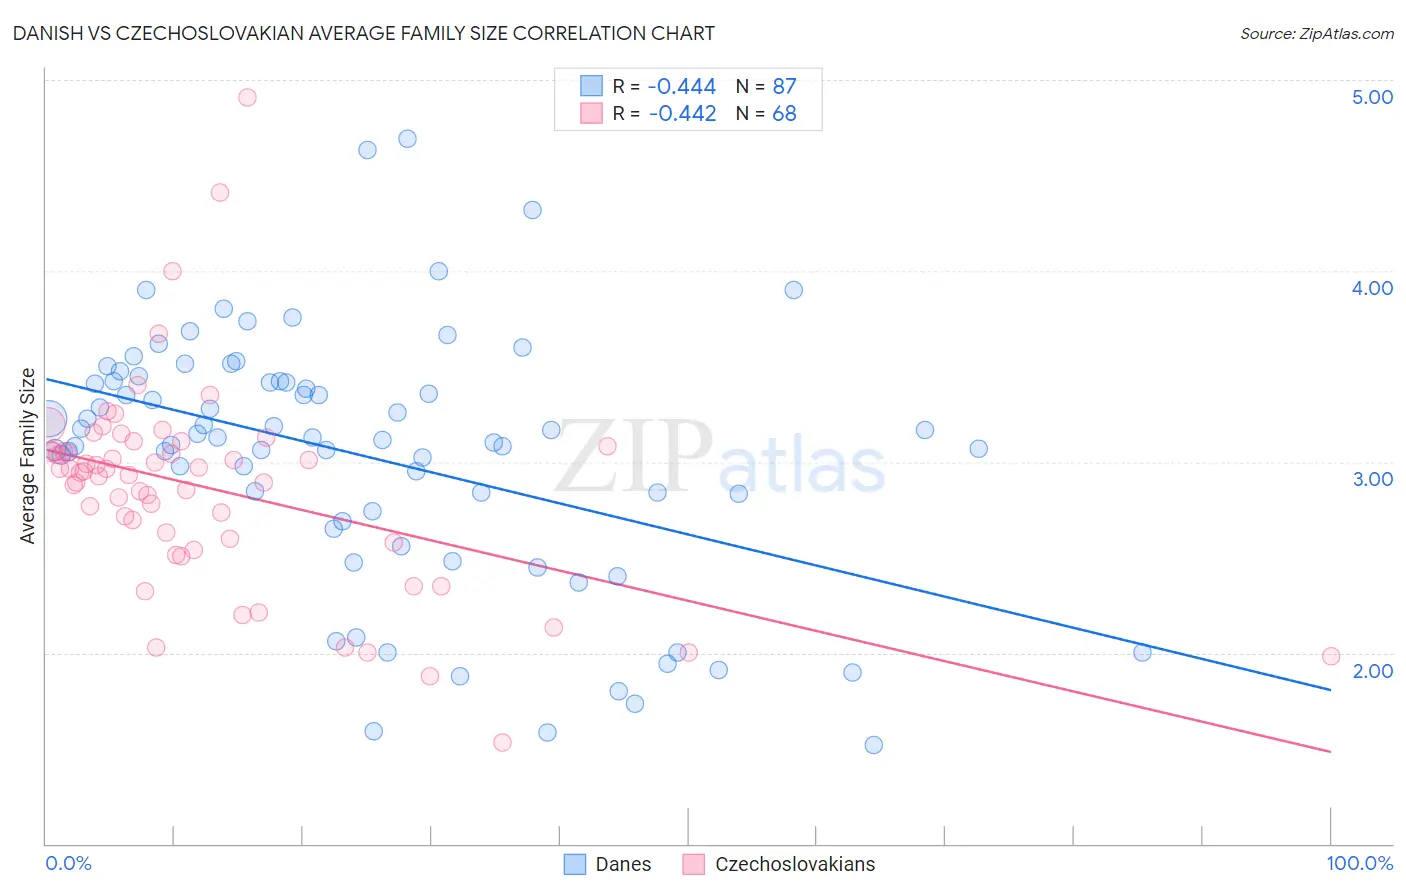
Danish vs Czechoslovakian Average Family Size Correlation Chart
The statistical analysis conducted on geographies consisting of 473,910,461 people shows a moderate negative correlation between the proportion of Danes and average family size in the United States with a correlation coefficient (R) of -0.444 and weighted average of 3.17. Similarly, the statistical analysis conducted on geographies consisting of 368,525,385 people shows a moderate negative correlation between the proportion of Czechoslovakians and average family size in the United States with a correlation coefficient (R) of -0.442 and weighted average of 3.13, a difference of 1.5%.
Average Family Size Correlation Summary
| Measurement | Danish | Czechoslovakian |
| Minimum | 1.52 | 1.53 |
| Maximum | 4.69 | 4.91 |
| Range | 3.17 | 3.38 |
| Mean | 3.03 | 2.86 |
| Median | 3.12 | 2.95 |
| Interquartile 25% (IQ1) | 2.69 | 2.59 |
| Interquartile 75% (IQ3) | 3.42 | 3.07 |
| Interquartile Range (IQR) | 0.73 | 0.48 |
| Standard Deviation (Sample) | 0.67 | 0.54 |
| Standard Deviation (Population) | 0.66 | 0.54 |
Similar Demographics by Average Family Size
Demographics Similar to Danes by Average Family Size
In terms of average family size, the demographic groups most similar to Danes are Cajun (3.17, a difference of 0.010%), Immigrants from Brazil (3.18, a difference of 0.040%), Immigrants from Belarus (3.17, a difference of 0.040%), Immigrants from Southern Europe (3.18, a difference of 0.070%), and Hungarian (3.18, a difference of 0.080%).
| Demographics | Rating | Rank | Average Family Size |
| Houma | 3.4 /100 | #239 | Tragic 3.18 |
| Osage | 3.2 /100 | #240 | Tragic 3.18 |
| Immigrants | Japan | 3.0 /100 | #241 | Tragic 3.18 |
| Hungarians | 3.0 /100 | #242 | Tragic 3.18 |
| Immigrants | Moldova | 2.9 /100 | #243 | Tragic 3.18 |
| Immigrants | Southern Europe | 2.9 /100 | #244 | Tragic 3.18 |
| Immigrants | Brazil | 2.7 /100 | #245 | Tragic 3.18 |
| Danes | 2.5 /100 | #246 | Tragic 3.17 |
| Cajuns | 2.4 /100 | #247 | Tragic 3.17 |
| Immigrants | Belarus | 2.3 /100 | #248 | Tragic 3.17 |
| Immigrants | Eastern Europe | 2.1 /100 | #249 | Tragic 3.17 |
| Puget Sound Salish | 1.9 /100 | #250 | Tragic 3.17 |
| Immigrants | Spain | 1.8 /100 | #251 | Tragic 3.17 |
| Immigrants | Saudi Arabia | 1.7 /100 | #252 | Tragic 3.17 |
| South Africans | 1.7 /100 | #253 | Tragic 3.17 |
Demographics Similar to Czechoslovakians by Average Family Size
In terms of average family size, the demographic groups most similar to Czechoslovakians are Northern European (3.13, a difference of 0.020%), Slavic (3.13, a difference of 0.030%), Immigrants from Northern Europe (3.13, a difference of 0.040%), Immigrants from Australia (3.13, a difference of 0.060%), and Bulgarian (3.13, a difference of 0.070%).
| Demographics | Rating | Rank | Average Family Size |
| British | 0.2 /100 | #303 | Tragic 3.13 |
| Immigrants | Switzerland | 0.2 /100 | #304 | Tragic 3.13 |
| Australians | 0.1 /100 | #305 | Tragic 3.13 |
| Immigrants | Ireland | 0.1 /100 | #306 | Tragic 3.13 |
| Immigrants | Serbia | 0.1 /100 | #307 | Tragic 3.13 |
| Slavs | 0.1 /100 | #308 | Tragic 3.13 |
| Northern Europeans | 0.1 /100 | #309 | Tragic 3.13 |
| Czechoslovakians | 0.1 /100 | #310 | Tragic 3.13 |
| Immigrants | Northern Europe | 0.1 /100 | #311 | Tragic 3.13 |
| Immigrants | Australia | 0.1 /100 | #312 | Tragic 3.13 |
| Bulgarians | 0.1 /100 | #313 | Tragic 3.13 |
| Russians | 0.1 /100 | #314 | Tragic 3.12 |
| Immigrants | Scotland | 0.1 /100 | #315 | Tragic 3.12 |
| Serbians | 0.1 /100 | #316 | Tragic 3.12 |
| Italians | 0.1 /100 | #317 | Tragic 3.12 |