Iranian vs Czechoslovakian Average Family Size
COMPARE
Iranian
Czechoslovakian
Average Family Size
Average Family Size Comparison
Iranians
Czechoslovakians
3.18
AVERAGE FAMILY SIZE
4.5/ 100
METRIC RATING
234th/ 347
METRIC RANK
3.13
AVERAGE FAMILY SIZE
0.1/ 100
METRIC RATING
310th/ 347
METRIC RANK
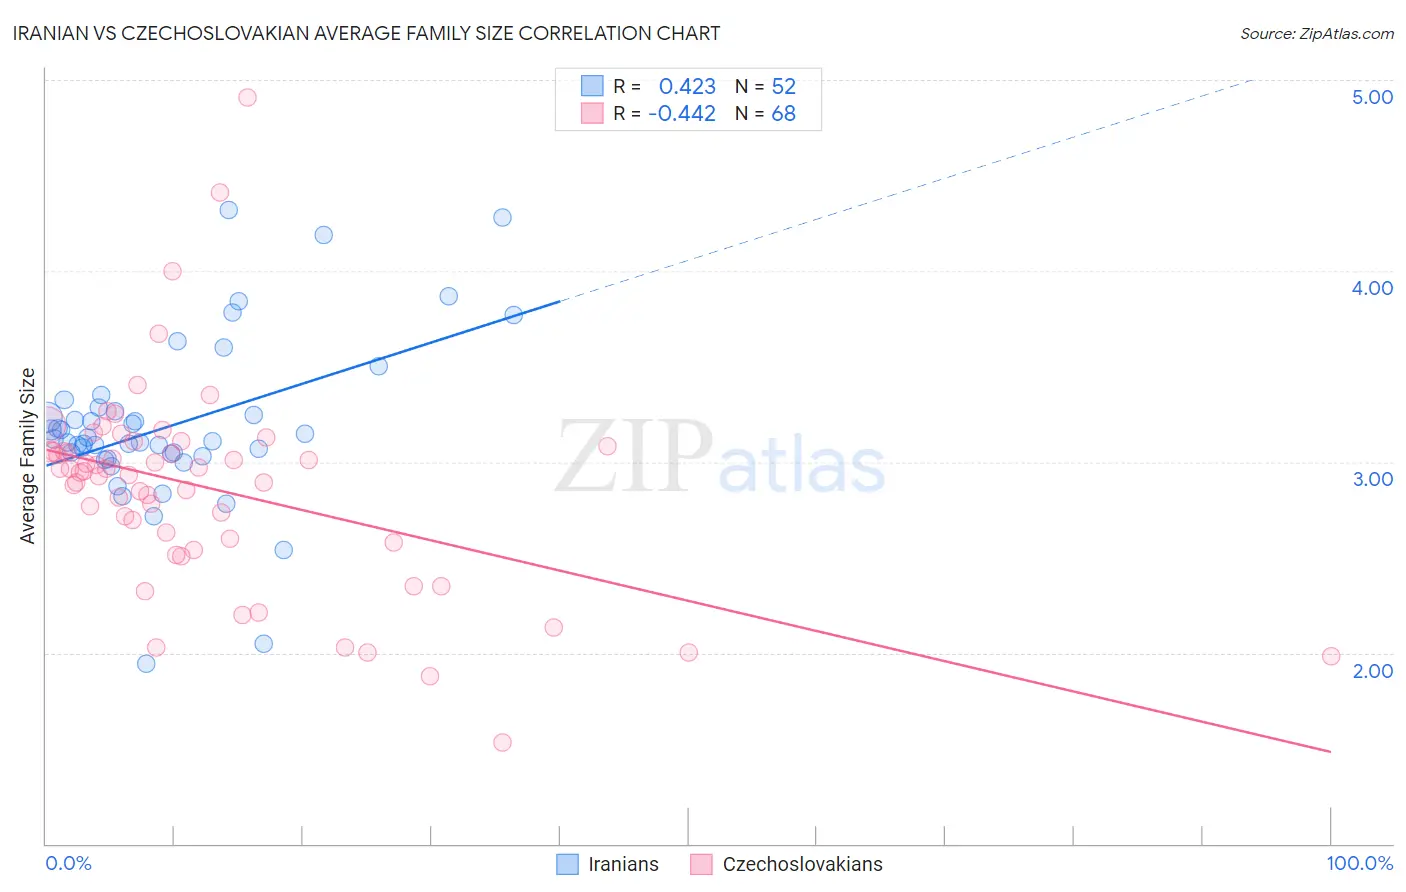
Iranian vs Czechoslovakian Average Family Size Correlation Chart
The statistical analysis conducted on geographies consisting of 316,654,945 people shows a moderate positive correlation between the proportion of Iranians and average family size in the United States with a correlation coefficient (R) of 0.423 and weighted average of 3.18. Similarly, the statistical analysis conducted on geographies consisting of 368,525,385 people shows a moderate negative correlation between the proportion of Czechoslovakians and average family size in the United States with a correlation coefficient (R) of -0.442 and weighted average of 3.13, a difference of 1.8%.
Average Family Size Correlation Summary
| Measurement | Iranian | Czechoslovakian |
| Minimum | 1.94 | 1.53 |
| Maximum | 4.32 | 4.91 |
| Range | 2.38 | 3.38 |
| Mean | 3.19 | 2.86 |
| Median | 3.12 | 2.95 |
| Interquartile 25% (IQ1) | 3.04 | 2.59 |
| Interquartile 75% (IQ3) | 3.27 | 3.07 |
| Interquartile Range (IQR) | 0.24 | 0.48 |
| Standard Deviation (Sample) | 0.44 | 0.54 |
| Standard Deviation (Population) | 0.44 | 0.54 |
Similar Demographics by Average Family Size
Demographics Similar to Iranians by Average Family Size
In terms of average family size, the demographic groups most similar to Iranians are Brazilian (3.18, a difference of 0.0%), Immigrants from Turkey (3.18, a difference of 0.020%), Cherokee (3.18, a difference of 0.030%), Immigrants from Portugal (3.18, a difference of 0.030%), and Icelander (3.19, a difference of 0.070%).
| Demographics | Rating | Rank | Average Family Size |
| Portuguese | 6.0 /100 | #227 | Tragic 3.19 |
| Immigrants | Nonimmigrants | 5.7 /100 | #228 | Tragic 3.19 |
| Immigrants | Italy | 5.3 /100 | #229 | Tragic 3.19 |
| Icelanders | 5.2 /100 | #230 | Tragic 3.19 |
| Basques | 5.2 /100 | #231 | Tragic 3.19 |
| Cherokee | 4.7 /100 | #232 | Tragic 3.18 |
| Brazilians | 4.5 /100 | #233 | Tragic 3.18 |
| Iranians | 4.5 /100 | #234 | Tragic 3.18 |
| Immigrants | Turkey | 4.2 /100 | #235 | Tragic 3.18 |
| Immigrants | Portugal | 4.2 /100 | #236 | Tragic 3.18 |
| Immigrants | Romania | 3.7 /100 | #237 | Tragic 3.18 |
| Romanians | 3.7 /100 | #238 | Tragic 3.18 |
| Houma | 3.4 /100 | #239 | Tragic 3.18 |
| Osage | 3.2 /100 | #240 | Tragic 3.18 |
| Immigrants | Japan | 3.0 /100 | #241 | Tragic 3.18 |
Demographics Similar to Czechoslovakians by Average Family Size
In terms of average family size, the demographic groups most similar to Czechoslovakians are Northern European (3.13, a difference of 0.020%), Slavic (3.13, a difference of 0.030%), Immigrants from Northern Europe (3.13, a difference of 0.040%), Immigrants from Australia (3.13, a difference of 0.060%), and Bulgarian (3.13, a difference of 0.070%).
| Demographics | Rating | Rank | Average Family Size |
| British | 0.2 /100 | #303 | Tragic 3.13 |
| Immigrants | Switzerland | 0.2 /100 | #304 | Tragic 3.13 |
| Australians | 0.1 /100 | #305 | Tragic 3.13 |
| Immigrants | Ireland | 0.1 /100 | #306 | Tragic 3.13 |
| Immigrants | Serbia | 0.1 /100 | #307 | Tragic 3.13 |
| Slavs | 0.1 /100 | #308 | Tragic 3.13 |
| Northern Europeans | 0.1 /100 | #309 | Tragic 3.13 |
| Czechoslovakians | 0.1 /100 | #310 | Tragic 3.13 |
| Immigrants | Northern Europe | 0.1 /100 | #311 | Tragic 3.13 |
| Immigrants | Australia | 0.1 /100 | #312 | Tragic 3.13 |
| Bulgarians | 0.1 /100 | #313 | Tragic 3.13 |
| Russians | 0.1 /100 | #314 | Tragic 3.12 |
| Immigrants | Scotland | 0.1 /100 | #315 | Tragic 3.12 |
| Serbians | 0.1 /100 | #316 | Tragic 3.12 |
| Italians | 0.1 /100 | #317 | Tragic 3.12 |