Paraguayan vs Turkish Currently Married
COMPARE
Paraguayan
Turkish
Currently Married
Currently Married Comparison
Paraguayans
Turks
47.2%
CURRENTLY MARRIED
77.8/ 100
METRIC RATING
137th/ 347
METRIC RANK
47.8%
CURRENTLY MARRIED
93.9/ 100
METRIC RATING
102nd/ 347
METRIC RANK
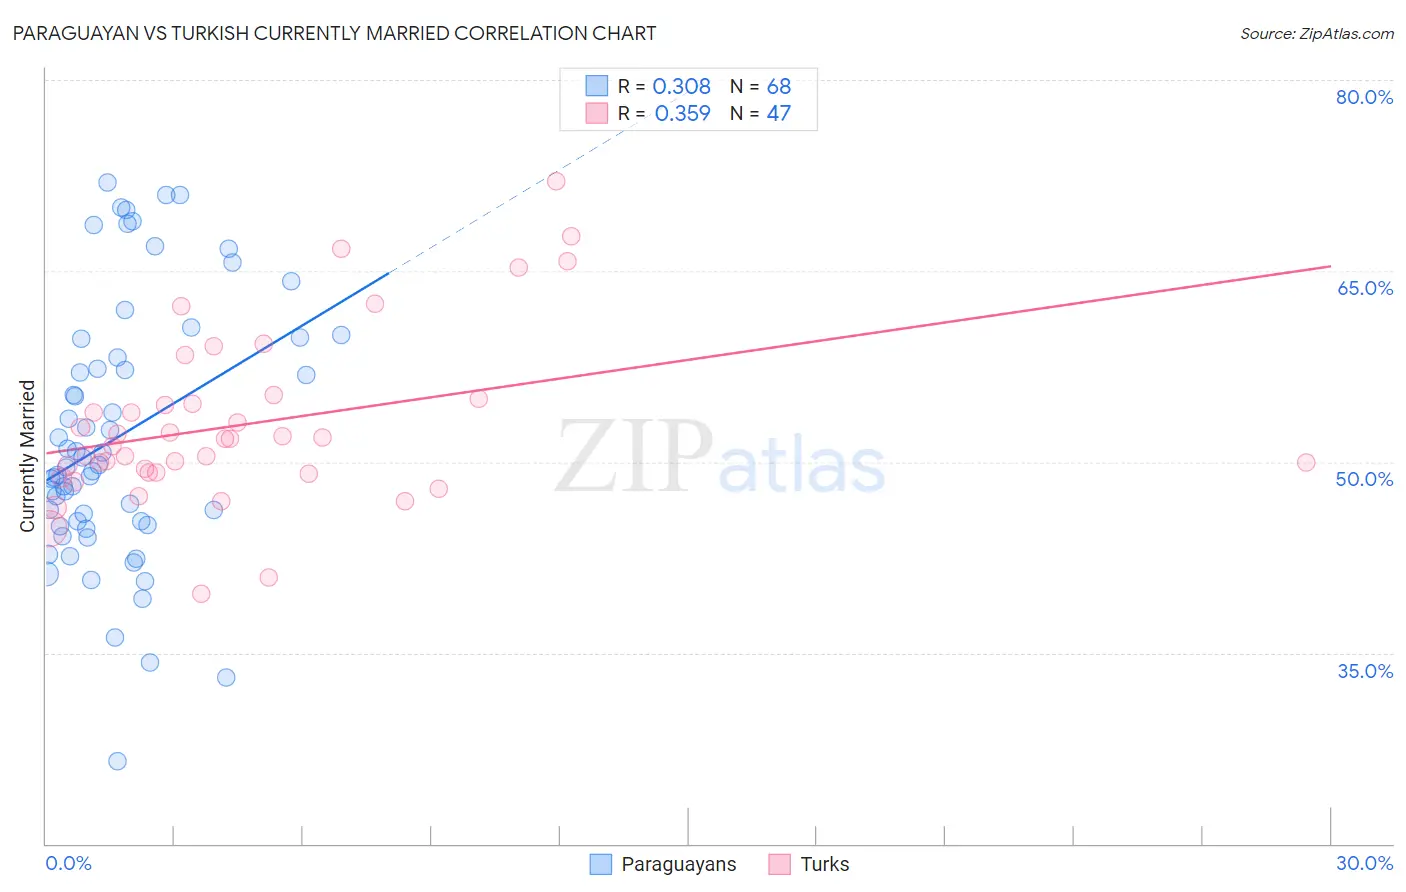
Paraguayan vs Turkish Currently Married Correlation Chart
The statistical analysis conducted on geographies consisting of 95,115,093 people shows a mild positive correlation between the proportion of Paraguayans and percentage of population currently married in the United States with a correlation coefficient (R) of 0.308 and weighted average of 47.2%. Similarly, the statistical analysis conducted on geographies consisting of 271,815,106 people shows a mild positive correlation between the proportion of Turks and percentage of population currently married in the United States with a correlation coefficient (R) of 0.359 and weighted average of 47.8%, a difference of 1.3%.
Currently Married Correlation Summary
| Measurement | Paraguayan | Turkish |
| Minimum | 26.5% | 39.7% |
| Maximum | 71.9% | 72.0% |
| Range | 45.4% | 32.3% |
| Mean | 52.0% | 53.0% |
| Median | 49.7% | 51.8% |
| Interquartile 25% (IQ1) | 45.2% | 49.1% |
| Interquartile 75% (IQ3) | 58.9% | 55.0% |
| Interquartile Range (IQR) | 13.8% | 5.9% |
| Standard Deviation (Sample) | 10.2% | 6.8% |
| Standard Deviation (Population) | 10.2% | 6.7% |
Similar Demographics by Currently Married
Demographics Similar to Paraguayans by Currently Married
In terms of currently married, the demographic groups most similar to Paraguayans are Immigrants from Vietnam (47.2%, a difference of 0.020%), Pakistani (47.2%, a difference of 0.020%), Yugoslavian (47.2%, a difference of 0.020%), Immigrants from Norway (47.2%, a difference of 0.10%), and Cajun (47.1%, a difference of 0.13%).
| Demographics | Rating | Rank | Currently Married |
| Immigrants | Iraq | 82.8 /100 | #130 | Excellent 47.3% |
| Icelanders | 82.4 /100 | #131 | Excellent 47.3% |
| Afghans | 81.8 /100 | #132 | Excellent 47.3% |
| Immigrants | Malaysia | 81.1 /100 | #133 | Excellent 47.3% |
| Immigrants | Australia | 81.1 /100 | #134 | Excellent 47.3% |
| Immigrants | Norway | 79.7 /100 | #135 | Good 47.2% |
| Immigrants | Vietnam | 78.2 /100 | #136 | Good 47.2% |
| Paraguayans | 77.8 /100 | #137 | Good 47.2% |
| Pakistanis | 77.5 /100 | #138 | Good 47.2% |
| Yugoslavians | 77.4 /100 | #139 | Good 47.2% |
| Cajuns | 75.3 /100 | #140 | Good 47.1% |
| Venezuelans | 74.4 /100 | #141 | Good 47.1% |
| Argentineans | 74.4 /100 | #142 | Good 47.1% |
| Guamanians/Chamorros | 74.2 /100 | #143 | Good 47.1% |
| Hmong | 73.4 /100 | #144 | Good 47.1% |
Demographics Similar to Turks by Currently Married
In terms of currently married, the demographic groups most similar to Turks are Immigrants from Germany (47.8%, a difference of 0.020%), Cypriot (47.8%, a difference of 0.030%), Celtic (47.8%, a difference of 0.040%), Serbian (47.8%, a difference of 0.050%), and Immigrants from Sweden (47.8%, a difference of 0.060%).
| Demographics | Rating | Rank | Currently Married |
| Immigrants | Bulgaria | 94.8 /100 | #95 | Exceptional 47.9% |
| Egyptians | 94.8 /100 | #96 | Exceptional 47.9% |
| Immigrants | Ukraine | 94.8 /100 | #97 | Exceptional 47.9% |
| Immigrants | China | 94.7 /100 | #98 | Exceptional 47.9% |
| Immigrants | Sweden | 94.3 /100 | #99 | Exceptional 47.8% |
| Celtics | 94.2 /100 | #100 | Exceptional 47.8% |
| Immigrants | Germany | 94.1 /100 | #101 | Exceptional 47.8% |
| Turks | 93.9 /100 | #102 | Exceptional 47.8% |
| Cypriots | 93.7 /100 | #103 | Exceptional 47.8% |
| Serbians | 93.6 /100 | #104 | Exceptional 47.8% |
| Immigrants | Singapore | 93.3 /100 | #105 | Exceptional 47.8% |
| Immigrants | Greece | 93.1 /100 | #106 | Exceptional 47.7% |
| Immigrants | Italy | 92.9 /100 | #107 | Exceptional 47.7% |
| Tsimshian | 92.4 /100 | #108 | Exceptional 47.7% |
| Immigrants | Egypt | 92.3 /100 | #109 | Exceptional 47.7% |