Asian vs Turkish Currently Married
COMPARE
Asian
Turkish
Currently Married
Currently Married Comparison
Asians
Turks
48.4%
CURRENTLY MARRIED
98.5/ 100
METRIC RATING
62nd/ 347
METRIC RANK
47.8%
CURRENTLY MARRIED
93.9/ 100
METRIC RATING
102nd/ 347
METRIC RANK
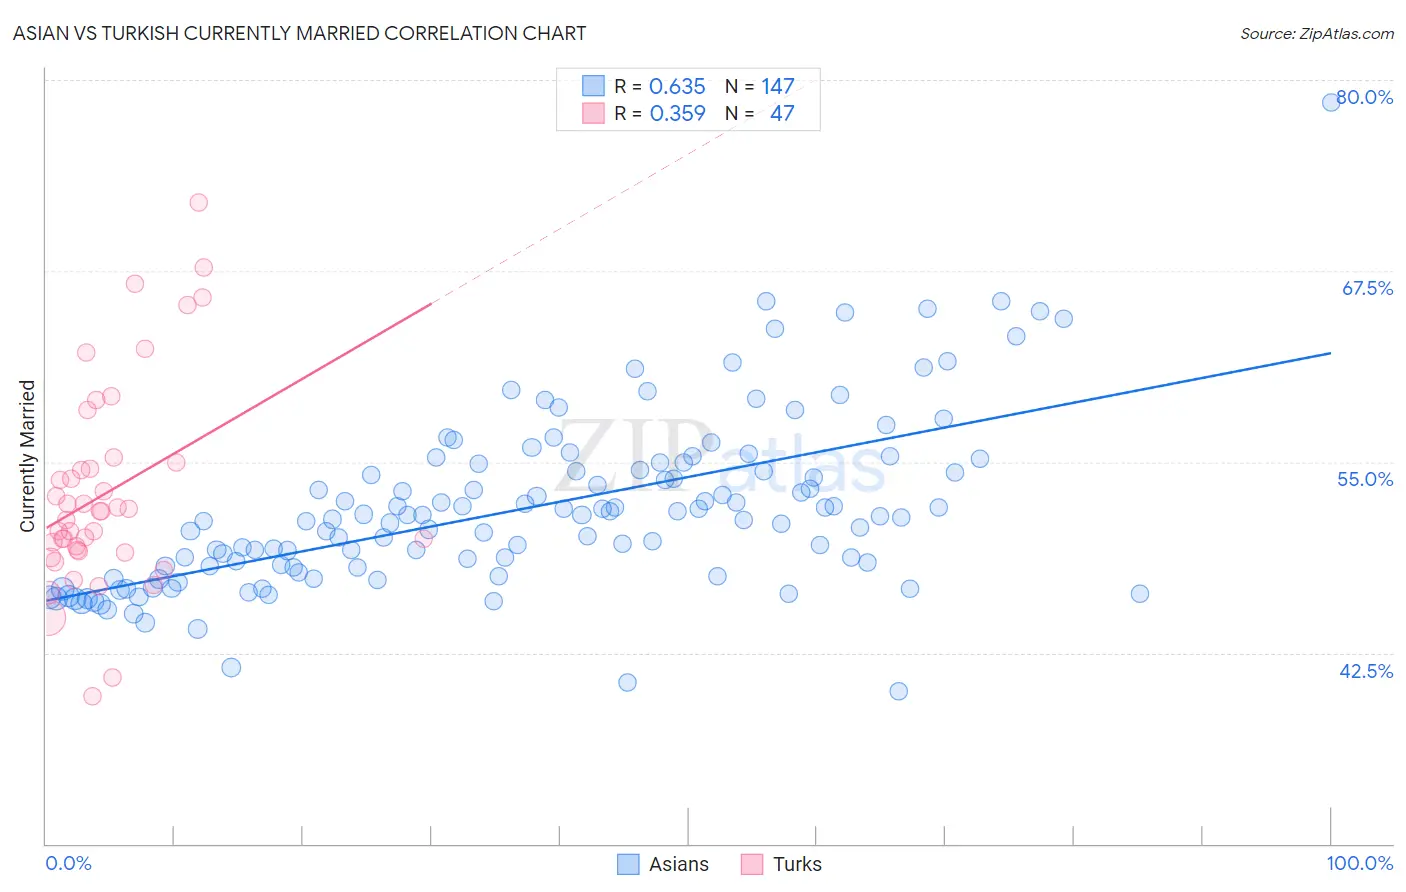
Asian vs Turkish Currently Married Correlation Chart
The statistical analysis conducted on geographies consisting of 550,785,629 people shows a significant positive correlation between the proportion of Asians and percentage of population currently married in the United States with a correlation coefficient (R) of 0.635 and weighted average of 48.4%. Similarly, the statistical analysis conducted on geographies consisting of 271,815,106 people shows a mild positive correlation between the proportion of Turks and percentage of population currently married in the United States with a correlation coefficient (R) of 0.359 and weighted average of 47.8%, a difference of 1.3%.
Currently Married Correlation Summary
| Measurement | Asian | Turkish |
| Minimum | 40.0% | 39.7% |
| Maximum | 78.5% | 72.0% |
| Range | 38.5% | 32.3% |
| Mean | 51.9% | 53.0% |
| Median | 51.4% | 51.8% |
| Interquartile 25% (IQ1) | 48.1% | 49.1% |
| Interquartile 75% (IQ3) | 54.5% | 55.0% |
| Interquartile Range (IQR) | 6.4% | 5.9% |
| Standard Deviation (Sample) | 5.7% | 6.8% |
| Standard Deviation (Population) | 5.7% | 6.7% |
Similar Demographics by Currently Married
Demographics Similar to Asians by Currently Married
In terms of currently married, the demographic groups most similar to Asians are Romanian (48.4%, a difference of 0.0%), Immigrants from Romania (48.4%, a difference of 0.010%), Immigrants from Ireland (48.4%, a difference of 0.030%), French (48.4%, a difference of 0.060%), and Immigrants from Netherlands (48.5%, a difference of 0.10%).
| Demographics | Rating | Rank | Currently Married |
| Immigrants | North Macedonia | 98.7 /100 | #55 | Exceptional 48.5% |
| Latvians | 98.7 /100 | #56 | Exceptional 48.5% |
| Immigrants | Netherlands | 98.6 /100 | #57 | Exceptional 48.5% |
| French | 98.6 /100 | #58 | Exceptional 48.4% |
| Immigrants | Ireland | 98.5 /100 | #59 | Exceptional 48.4% |
| Immigrants | Romania | 98.5 /100 | #60 | Exceptional 48.4% |
| Romanians | 98.5 /100 | #61 | Exceptional 48.4% |
| Asians | 98.5 /100 | #62 | Exceptional 48.4% |
| Slavs | 98.3 /100 | #63 | Exceptional 48.4% |
| Immigrants | Czechoslovakia | 98.3 /100 | #64 | Exceptional 48.4% |
| Ukrainians | 98.3 /100 | #65 | Exceptional 48.4% |
| Tongans | 98.2 /100 | #66 | Exceptional 48.3% |
| Slovaks | 98.2 /100 | #67 | Exceptional 48.3% |
| Immigrants | England | 98.2 /100 | #68 | Exceptional 48.3% |
| Canadians | 98.1 /100 | #69 | Exceptional 48.3% |
Demographics Similar to Turks by Currently Married
In terms of currently married, the demographic groups most similar to Turks are Immigrants from Germany (47.8%, a difference of 0.020%), Cypriot (47.8%, a difference of 0.030%), Celtic (47.8%, a difference of 0.040%), Serbian (47.8%, a difference of 0.050%), and Immigrants from Sweden (47.8%, a difference of 0.060%).
| Demographics | Rating | Rank | Currently Married |
| Immigrants | Bulgaria | 94.8 /100 | #95 | Exceptional 47.9% |
| Egyptians | 94.8 /100 | #96 | Exceptional 47.9% |
| Immigrants | Ukraine | 94.8 /100 | #97 | Exceptional 47.9% |
| Immigrants | China | 94.7 /100 | #98 | Exceptional 47.9% |
| Immigrants | Sweden | 94.3 /100 | #99 | Exceptional 47.8% |
| Celtics | 94.2 /100 | #100 | Exceptional 47.8% |
| Immigrants | Germany | 94.1 /100 | #101 | Exceptional 47.8% |
| Turks | 93.9 /100 | #102 | Exceptional 47.8% |
| Cypriots | 93.7 /100 | #103 | Exceptional 47.8% |
| Serbians | 93.6 /100 | #104 | Exceptional 47.8% |
| Immigrants | Singapore | 93.3 /100 | #105 | Exceptional 47.8% |
| Immigrants | Greece | 93.1 /100 | #106 | Exceptional 47.7% |
| Immigrants | Italy | 92.9 /100 | #107 | Exceptional 47.7% |
| Tsimshian | 92.4 /100 | #108 | Exceptional 47.7% |
| Immigrants | Egypt | 92.3 /100 | #109 | Exceptional 47.7% |