Crow vs Immigrants from Kenya Median Family Income
COMPARE
Crow
Immigrants from Kenya
Median Family Income
Median Family Income Comparison
Crow
Immigrants from Kenya
$76,605
MEDIAN FAMILY INCOME
0.0/ 100
METRIC RATING
342nd/ 347
METRIC RANK
$100,679
MEDIAN FAMILY INCOME
26.5/ 100
METRIC RATING
192nd/ 347
METRIC RANK
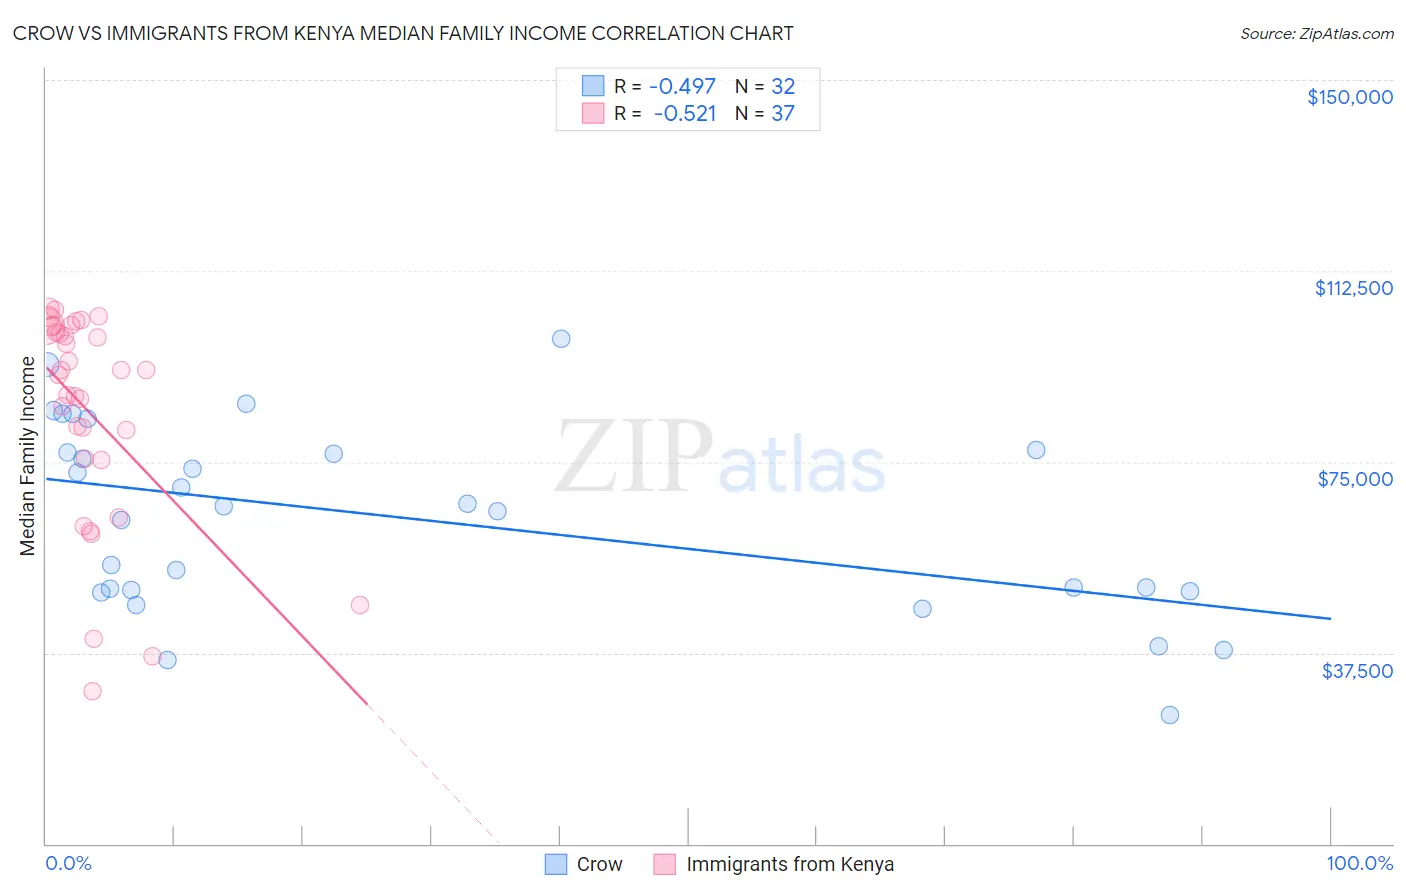
Crow vs Immigrants from Kenya Median Family Income Correlation Chart
The statistical analysis conducted on geographies consisting of 59,195,543 people shows a moderate negative correlation between the proportion of Crow and median family income in the United States with a correlation coefficient (R) of -0.497 and weighted average of $76,605. Similarly, the statistical analysis conducted on geographies consisting of 217,962,146 people shows a substantial negative correlation between the proportion of Immigrants from Kenya and median family income in the United States with a correlation coefficient (R) of -0.521 and weighted average of $100,679, a difference of 31.4%.
Median Family Income Correlation Summary
| Measurement | Crow | Immigrants from Kenya |
| Minimum | $25,179 | $29,978 |
| Maximum | $99,219 | $105,113 |
| Range | $74,040 | $75,135 |
| Mean | $63,807 | $84,908 |
| Median | $65,747 | $92,944 |
| Interquartile 25% (IQ1) | $49,683 | $75,494 |
| Interquartile 75% (IQ3) | $77,098 | $101,628 |
| Interquartile Range (IQR) | $27,414 | $26,135 |
| Standard Deviation (Sample) | $18,632 | $20,915 |
| Standard Deviation (Population) | $18,339 | $20,630 |
Similar Demographics by Median Family Income
Demographics Similar to Crow by Median Family Income
In terms of median family income, the demographic groups most similar to Crow are Pueblo ($76,880, a difference of 0.36%), Houma ($76,188, a difference of 0.55%), Hopi ($77,188, a difference of 0.76%), Pima ($77,431, a difference of 1.1%), and Immigrants from Yemen ($77,457, a difference of 1.1%).
| Demographics | Rating | Rank | Median Family Income |
| Kiowa | 0.0 /100 | #333 | Tragic $80,885 |
| Menominee | 0.0 /100 | #334 | Tragic $79,563 |
| Yup'ik | 0.0 /100 | #335 | Tragic $79,290 |
| Immigrants | Cuba | 0.0 /100 | #336 | Tragic $78,249 |
| Yuman | 0.0 /100 | #337 | Tragic $78,055 |
| Immigrants | Yemen | 0.0 /100 | #338 | Tragic $77,457 |
| Pima | 0.0 /100 | #339 | Tragic $77,431 |
| Hopi | 0.0 /100 | #340 | Tragic $77,188 |
| Pueblo | 0.0 /100 | #341 | Tragic $76,880 |
| Crow | 0.0 /100 | #342 | Tragic $76,605 |
| Houma | 0.0 /100 | #343 | Tragic $76,188 |
| Tohono O'odham | 0.0 /100 | #344 | Tragic $72,193 |
| Navajo | 0.0 /100 | #345 | Tragic $70,989 |
| Puerto Ricans | 0.0 /100 | #346 | Tragic $70,423 |
| Lumbee | 0.0 /100 | #347 | Tragic $68,679 |
Demographics Similar to Immigrants from Kenya by Median Family Income
In terms of median family income, the demographic groups most similar to Immigrants from Kenya are Iraqi ($100,658, a difference of 0.020%), Uruguayan ($100,656, a difference of 0.020%), Colombian ($100,750, a difference of 0.070%), Immigrants from South America ($100,414, a difference of 0.26%), and Immigrants ($100,962, a difference of 0.28%).
| Demographics | Rating | Rank | Median Family Income |
| Dutch | 31.9 /100 | #185 | Fair $101,192 |
| Celtics | 31.3 /100 | #186 | Fair $101,139 |
| Tlingit-Haida | 30.8 /100 | #187 | Fair $101,092 |
| Guamanians/Chamorros | 30.5 /100 | #188 | Fair $101,061 |
| Immigrants | Portugal | 29.6 /100 | #189 | Fair $100,984 |
| Immigrants | Immigrants | 29.4 /100 | #190 | Fair $100,962 |
| Colombians | 27.2 /100 | #191 | Fair $100,750 |
| Immigrants | Kenya | 26.5 /100 | #192 | Fair $100,679 |
| Iraqis | 26.3 /100 | #193 | Fair $100,658 |
| Uruguayans | 26.3 /100 | #194 | Fair $100,656 |
| Immigrants | South America | 23.9 /100 | #195 | Fair $100,414 |
| Samoans | 23.3 /100 | #196 | Fair $100,344 |
| Immigrants | Cameroon | 22.8 /100 | #197 | Fair $100,289 |
| Immigrants | Africa | 22.5 /100 | #198 | Fair $100,256 |
| Yugoslavians | 21.3 /100 | #199 | Fair $100,119 |