Mexican American Indian vs Immigrants from Kenya Currently Married
COMPARE
Mexican American Indian
Immigrants from Kenya
Currently Married
Currently Married Comparison
Mexican American Indians
Immigrants from Kenya
44.5%
CURRENTLY MARRIED
0.7/ 100
METRIC RATING
240th/ 347
METRIC RANK
44.9%
CURRENTLY MARRIED
1.6/ 100
METRIC RATING
230th/ 347
METRIC RANK
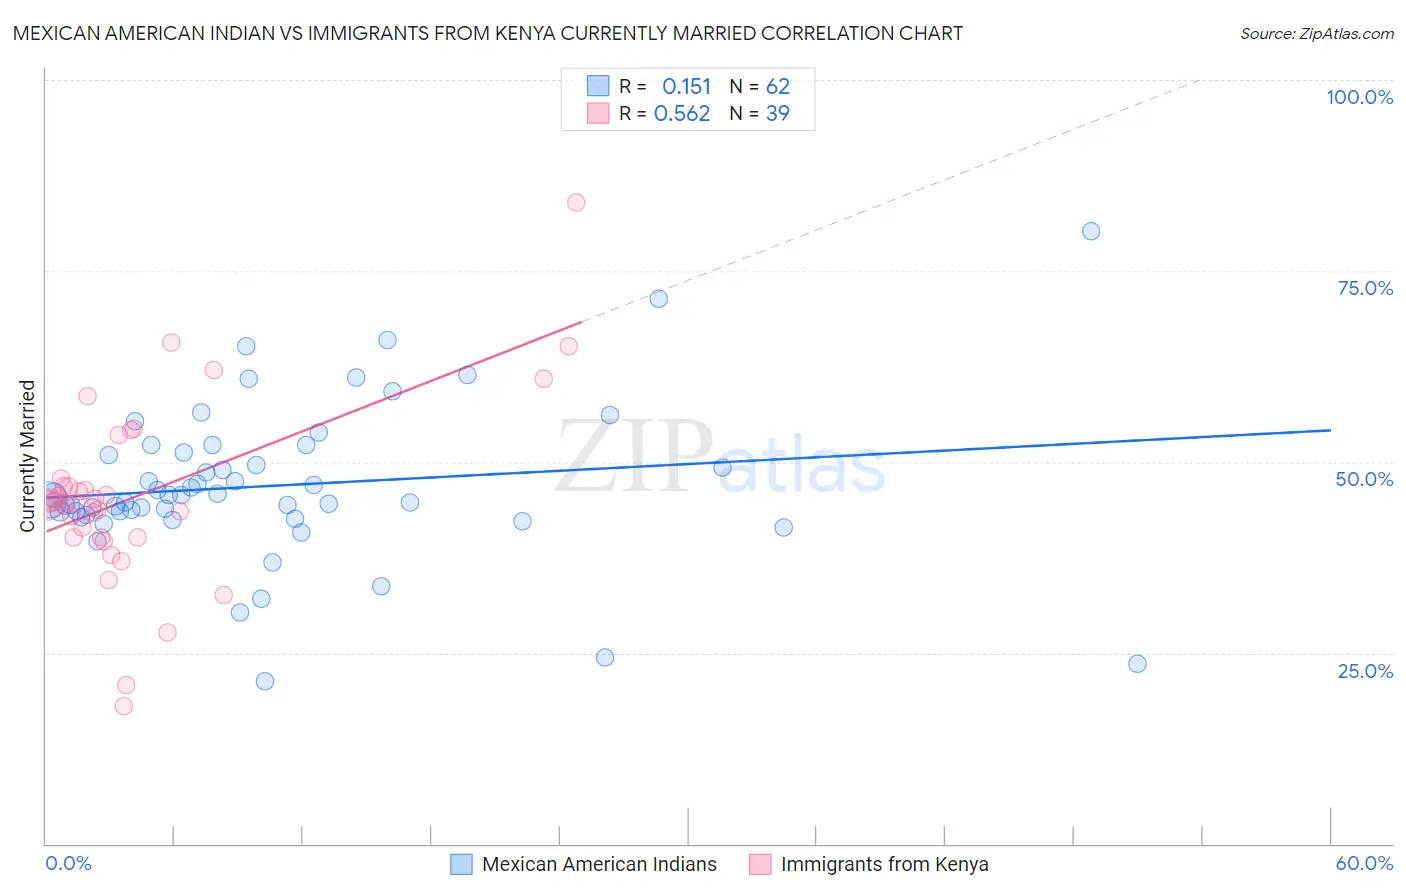
Mexican American Indian vs Immigrants from Kenya Currently Married Correlation Chart
The statistical analysis conducted on geographies consisting of 317,602,518 people shows a poor positive correlation between the proportion of Mexican American Indians and percentage of population currently married in the United States with a correlation coefficient (R) of 0.151 and weighted average of 44.5%. Similarly, the statistical analysis conducted on geographies consisting of 218,071,157 people shows a substantial positive correlation between the proportion of Immigrants from Kenya and percentage of population currently married in the United States with a correlation coefficient (R) of 0.562 and weighted average of 44.9%, a difference of 0.75%.
Currently Married Correlation Summary
| Measurement | Mexican American Indian | Immigrants from Kenya |
| Minimum | 21.3% | 18.0% |
| Maximum | 80.2% | 83.9% |
| Range | 58.9% | 65.9% |
| Mean | 46.9% | 45.6% |
| Median | 45.3% | 44.8% |
| Interquartile 25% (IQ1) | 43.0% | 40.1% |
| Interquartile 75% (IQ3) | 51.2% | 47.8% |
| Interquartile Range (IQR) | 8.1% | 7.8% |
| Standard Deviation (Sample) | 10.3% | 12.0% |
| Standard Deviation (Population) | 10.2% | 11.8% |
Demographics Similar to Mexican American Indians and Immigrants from Kenya by Currently Married
In terms of currently married, the demographic groups most similar to Mexican American Indians are Immigrants from Mexico (44.5%, a difference of 0.0%), Ethiopian (44.5%, a difference of 0.060%), Immigrants from Cambodia (44.5%, a difference of 0.090%), Immigrants from Ethiopia (44.5%, a difference of 0.10%), and Moroccan (44.6%, a difference of 0.14%). Similarly, the demographic groups most similar to Immigrants from Kenya are Cree (44.9%, a difference of 0.040%), Immigrants from Panama (44.9%, a difference of 0.040%), Immigrants from Uruguay (45.0%, a difference of 0.23%), Comanche (45.0%, a difference of 0.24%), and Spanish American (45.0%, a difference of 0.24%).
| Demographics | Rating | Rank | Currently Married |
| French American Indians | 2.2 /100 | #225 | Tragic 45.0% |
| Comanche | 2.1 /100 | #226 | Tragic 45.0% |
| Spanish Americans | 2.1 /100 | #227 | Tragic 45.0% |
| Immigrants | Uruguay | 2.0 /100 | #228 | Tragic 45.0% |
| Cree | 1.7 /100 | #229 | Tragic 44.9% |
| Immigrants | Kenya | 1.6 /100 | #230 | Tragic 44.9% |
| Immigrants | Panama | 1.5 /100 | #231 | Tragic 44.9% |
| Nepalese | 1.2 /100 | #232 | Tragic 44.7% |
| Immigrants | Saudi Arabia | 1.1 /100 | #233 | Tragic 44.7% |
| Iroquois | 1.1 /100 | #234 | Tragic 44.7% |
| Alaskan Athabascans | 0.9 /100 | #235 | Tragic 44.6% |
| Cubans | 0.9 /100 | #236 | Tragic 44.6% |
| Seminole | 0.9 /100 | #237 | Tragic 44.6% |
| Moroccans | 0.9 /100 | #238 | Tragic 44.6% |
| Immigrants | Mexico | 0.7 /100 | #239 | Tragic 44.5% |
| Mexican American Indians | 0.7 /100 | #240 | Tragic 44.5% |
| Ethiopians | 0.7 /100 | #241 | Tragic 44.5% |
| Immigrants | Cambodia | 0.7 /100 | #242 | Tragic 44.5% |
| Immigrants | Ethiopia | 0.7 /100 | #243 | Tragic 44.5% |
| Japanese | 0.6 /100 | #244 | Tragic 44.5% |
| Immigrants | Armenia | 0.4 /100 | #245 | Tragic 44.3% |