Latvian vs Immigrants from Kenya Currently Married
COMPARE
Latvian
Immigrants from Kenya
Currently Married
Currently Married Comparison
Latvians
Immigrants from Kenya
48.5%
CURRENTLY MARRIED
98.7/ 100
METRIC RATING
56th/ 347
METRIC RANK
44.9%
CURRENTLY MARRIED
1.6/ 100
METRIC RATING
230th/ 347
METRIC RANK
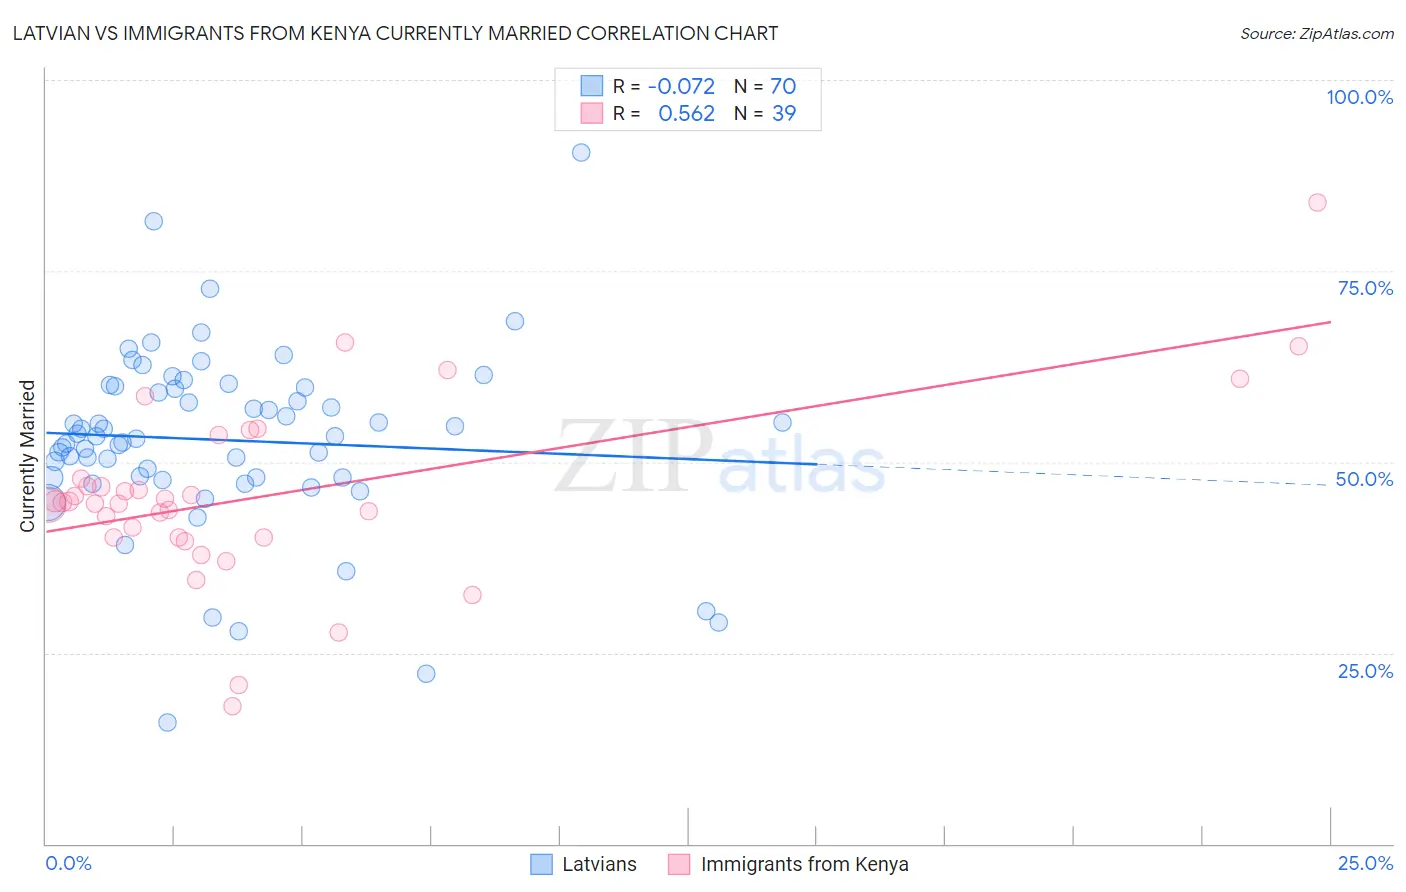
Latvian vs Immigrants from Kenya Currently Married Correlation Chart
The statistical analysis conducted on geographies consisting of 220,695,418 people shows a slight negative correlation between the proportion of Latvians and percentage of population currently married in the United States with a correlation coefficient (R) of -0.072 and weighted average of 48.5%. Similarly, the statistical analysis conducted on geographies consisting of 218,071,157 people shows a substantial positive correlation between the proportion of Immigrants from Kenya and percentage of population currently married in the United States with a correlation coefficient (R) of 0.562 and weighted average of 44.9%, a difference of 8.0%.
Currently Married Correlation Summary
| Measurement | Latvian | Immigrants from Kenya |
| Minimum | 15.8% | 18.0% |
| Maximum | 90.5% | 83.9% |
| Range | 74.7% | 65.9% |
| Mean | 52.8% | 45.6% |
| Median | 53.4% | 44.8% |
| Interquartile 25% (IQ1) | 47.9% | 40.1% |
| Interquartile 75% (IQ3) | 59.7% | 47.8% |
| Interquartile Range (IQR) | 11.8% | 7.8% |
| Standard Deviation (Sample) | 12.1% | 12.0% |
| Standard Deviation (Population) | 12.0% | 11.8% |
Similar Demographics by Currently Married
Demographics Similar to Latvians by Currently Married
In terms of currently married, the demographic groups most similar to Latvians are Immigrants from Moldova (48.5%, a difference of 0.0%), Immigrants from North Macedonia (48.5%, a difference of 0.0%), Immigrants from Netherlands (48.5%, a difference of 0.030%), Immigrants from Austria (48.5%, a difference of 0.070%), and French (48.4%, a difference of 0.070%).
| Demographics | Rating | Rank | Currently Married |
| Bhutanese | 99.1 /100 | #49 | Exceptional 48.6% |
| Iranians | 99.0 /100 | #50 | Exceptional 48.6% |
| Whites/Caucasians | 99.0 /100 | #51 | Exceptional 48.6% |
| Russians | 98.9 /100 | #52 | Exceptional 48.6% |
| Immigrants | Austria | 98.8 /100 | #53 | Exceptional 48.5% |
| Immigrants | Moldova | 98.7 /100 | #54 | Exceptional 48.5% |
| Immigrants | North Macedonia | 98.7 /100 | #55 | Exceptional 48.5% |
| Latvians | 98.7 /100 | #56 | Exceptional 48.5% |
| Immigrants | Netherlands | 98.6 /100 | #57 | Exceptional 48.5% |
| French | 98.6 /100 | #58 | Exceptional 48.4% |
| Immigrants | Ireland | 98.5 /100 | #59 | Exceptional 48.4% |
| Immigrants | Romania | 98.5 /100 | #60 | Exceptional 48.4% |
| Romanians | 98.5 /100 | #61 | Exceptional 48.4% |
| Asians | 98.5 /100 | #62 | Exceptional 48.4% |
| Slavs | 98.3 /100 | #63 | Exceptional 48.4% |
Demographics Similar to Immigrants from Kenya by Currently Married
In terms of currently married, the demographic groups most similar to Immigrants from Kenya are Cree (44.9%, a difference of 0.040%), Immigrants from Panama (44.9%, a difference of 0.040%), Immigrants from Uruguay (45.0%, a difference of 0.23%), Comanche (45.0%, a difference of 0.24%), and Spanish American (45.0%, a difference of 0.24%).
| Demographics | Rating | Rank | Currently Married |
| Immigrants | Laos | 2.3 /100 | #223 | Tragic 45.0% |
| Immigrants | Uganda | 2.2 /100 | #224 | Tragic 45.0% |
| French American Indians | 2.2 /100 | #225 | Tragic 45.0% |
| Comanche | 2.1 /100 | #226 | Tragic 45.0% |
| Spanish Americans | 2.1 /100 | #227 | Tragic 45.0% |
| Immigrants | Uruguay | 2.0 /100 | #228 | Tragic 45.0% |
| Cree | 1.7 /100 | #229 | Tragic 44.9% |
| Immigrants | Kenya | 1.6 /100 | #230 | Tragic 44.9% |
| Immigrants | Panama | 1.5 /100 | #231 | Tragic 44.9% |
| Nepalese | 1.2 /100 | #232 | Tragic 44.7% |
| Immigrants | Saudi Arabia | 1.1 /100 | #233 | Tragic 44.7% |
| Iroquois | 1.1 /100 | #234 | Tragic 44.7% |
| Alaskan Athabascans | 0.9 /100 | #235 | Tragic 44.6% |
| Cubans | 0.9 /100 | #236 | Tragic 44.6% |
| Seminole | 0.9 /100 | #237 | Tragic 44.6% |