Chickasaw vs Russian Divorced or Separated
COMPARE
Chickasaw
Russian
Divorced or Separated
Divorced or Separated Comparison
Chickasaw
Russians
14.2%
DIVORCED OR SEPARATED
0.0/ 100
METRIC RATING
340th/ 347
METRIC RANK
11.5%
DIVORCED OR SEPARATED
99.4/ 100
METRIC RATING
81st/ 347
METRIC RANK
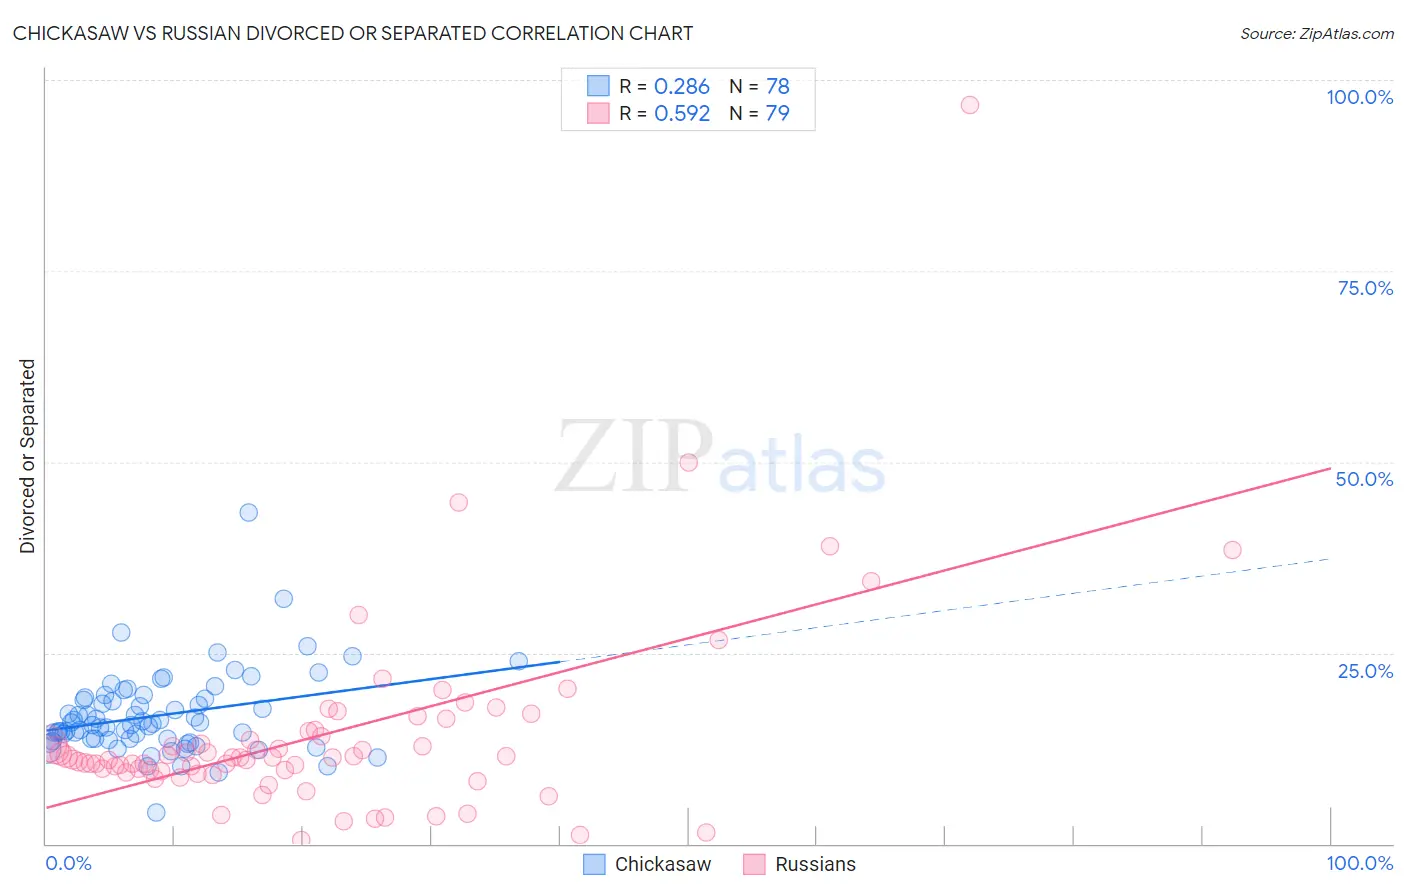
Chickasaw vs Russian Divorced or Separated Correlation Chart
The statistical analysis conducted on geographies consisting of 147,714,015 people shows a weak positive correlation between the proportion of Chickasaw and percentage of population currently divorced or separated in the United States with a correlation coefficient (R) of 0.286 and weighted average of 14.2%. Similarly, the statistical analysis conducted on geographies consisting of 511,901,777 people shows a substantial positive correlation between the proportion of Russians and percentage of population currently divorced or separated in the United States with a correlation coefficient (R) of 0.592 and weighted average of 11.5%, a difference of 23.3%.
Divorced or Separated Correlation Summary
| Measurement | Chickasaw | Russian |
| Minimum | 4.1% | 0.50% |
| Maximum | 43.4% | 96.8% |
| Range | 39.3% | 96.3% |
| Mean | 16.8% | 14.3% |
| Median | 15.7% | 11.3% |
| Interquartile 25% (IQ1) | 13.8% | 9.6% |
| Interquartile 75% (IQ3) | 18.9% | 14.8% |
| Interquartile Range (IQR) | 5.1% | 5.2% |
| Standard Deviation (Sample) | 5.4% | 13.0% |
| Standard Deviation (Population) | 5.4% | 12.9% |
Similar Demographics by Divorced or Separated
Demographics Similar to Chickasaw by Divorced or Separated
In terms of divorced or separated, the demographic groups most similar to Chickasaw are Colville (14.2%, a difference of 0.040%), Bahamian (14.2%, a difference of 0.20%), Seminole (14.3%, a difference of 0.36%), Choctaw (14.1%, a difference of 0.57%), and Crow (14.1%, a difference of 0.88%).
| Demographics | Rating | Rank | Divorced or Separated |
| Puerto Ricans | 0.0 /100 | #333 | Tragic 13.9% |
| Immigrants | Bahamas | 0.0 /100 | #334 | Tragic 13.9% |
| Dutch West Indians | 0.0 /100 | #335 | Tragic 14.0% |
| Shoshone | 0.0 /100 | #336 | Tragic 14.0% |
| Crow | 0.0 /100 | #337 | Tragic 14.1% |
| Choctaw | 0.0 /100 | #338 | Tragic 14.1% |
| Colville | 0.0 /100 | #339 | Tragic 14.2% |
| Chickasaw | 0.0 /100 | #340 | Tragic 14.2% |
| Bahamians | 0.0 /100 | #341 | Tragic 14.2% |
| Seminole | 0.0 /100 | #342 | Tragic 14.3% |
| Creek | 0.0 /100 | #343 | Tragic 14.4% |
| Cubans | 0.0 /100 | #344 | Tragic 14.5% |
| Kiowa | 0.0 /100 | #345 | Tragic 14.5% |
| Arapaho | 0.0 /100 | #346 | Tragic 14.8% |
| Immigrants | Cuba | 0.0 /100 | #347 | Tragic 15.2% |
Demographics Similar to Russians by Divorced or Separated
In terms of divorced or separated, the demographic groups most similar to Russians are Immigrants from Switzerland (11.5%, a difference of 0.010%), Guyanese (11.5%, a difference of 0.030%), Afghan (11.5%, a difference of 0.070%), Immigrants from Romania (11.5%, a difference of 0.080%), and Immigrants from Bulgaria (11.5%, a difference of 0.11%).
| Demographics | Rating | Rank | Divorced or Separated |
| Taiwanese | 99.6 /100 | #74 | Exceptional 11.5% |
| Immigrants | Northern Africa | 99.6 /100 | #75 | Exceptional 11.5% |
| Albanians | 99.6 /100 | #76 | Exceptional 11.5% |
| Immigrants | Italy | 99.5 /100 | #77 | Exceptional 11.5% |
| Afghans | 99.4 /100 | #78 | Exceptional 11.5% |
| Guyanese | 99.4 /100 | #79 | Exceptional 11.5% |
| Immigrants | Switzerland | 99.4 /100 | #80 | Exceptional 11.5% |
| Russians | 99.4 /100 | #81 | Exceptional 11.5% |
| Immigrants | Romania | 99.3 /100 | #82 | Exceptional 11.5% |
| Immigrants | Bulgaria | 99.3 /100 | #83 | Exceptional 11.5% |
| Bulgarians | 99.3 /100 | #84 | Exceptional 11.5% |
| Immigrants | Albania | 99.3 /100 | #85 | Exceptional 11.5% |
| Immigrants | Latvia | 99.2 /100 | #86 | Exceptional 11.6% |
| Immigrants | Nepal | 99.2 /100 | #87 | Exceptional 11.6% |
| Immigrants | Europe | 99.2 /100 | #88 | Exceptional 11.6% |