Ghanaian vs Immigrants from Singapore Average Family Size
COMPARE
Ghanaian
Immigrants from Singapore
Average Family Size
Average Family Size Comparison
Ghanaians
Immigrants from Singapore
3.29
AVERAGE FAMILY SIZE
98.0/ 100
METRIC RATING
107th/ 347
METRIC RANK
3.16
AVERAGE FAMILY SIZE
0.7/ 100
METRIC RATING
269th/ 347
METRIC RANK
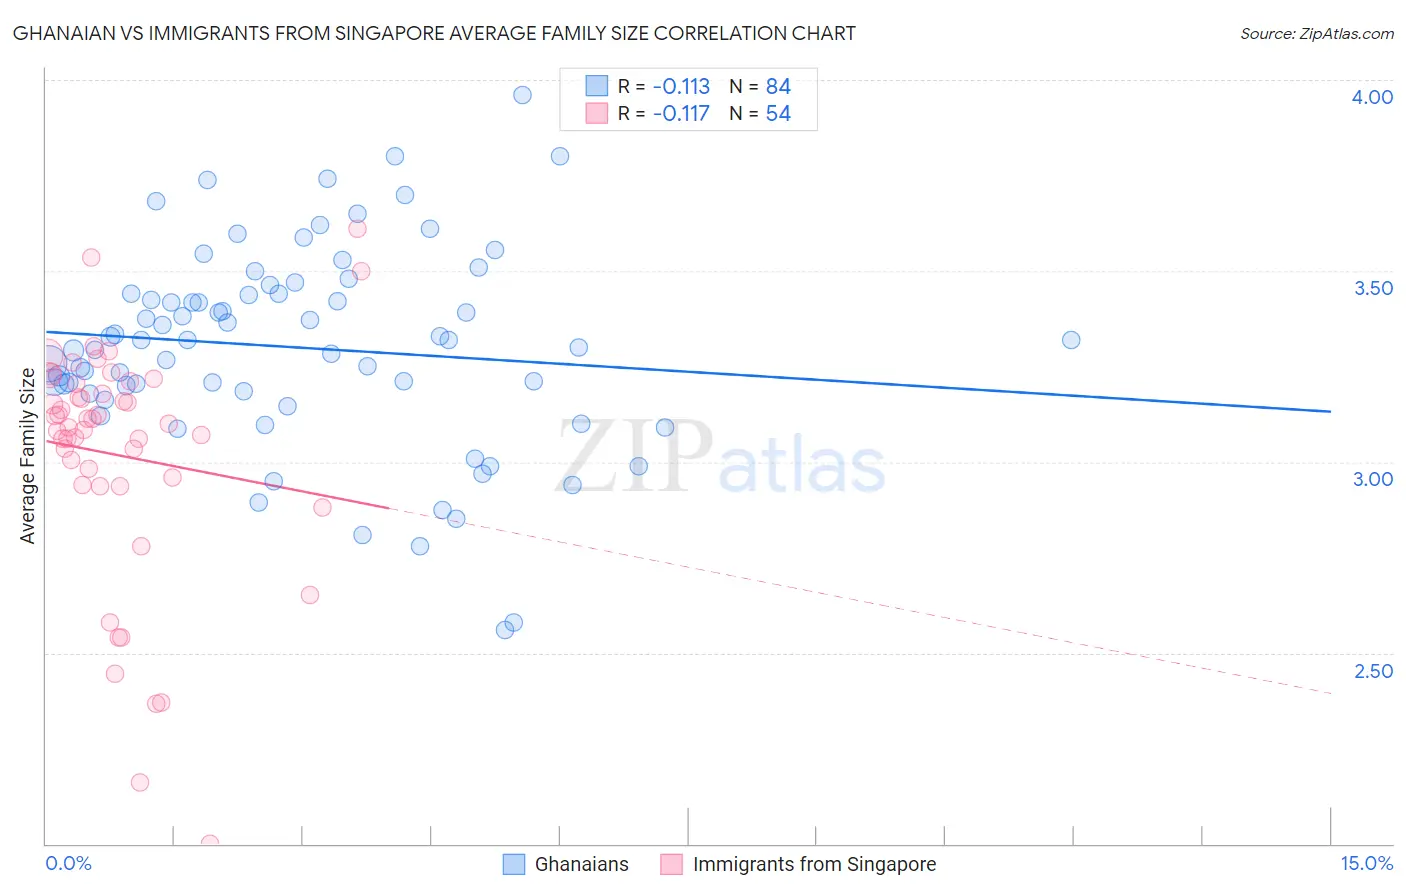
Ghanaian vs Immigrants from Singapore Average Family Size Correlation Chart
The statistical analysis conducted on geographies consisting of 190,523,422 people shows a poor negative correlation between the proportion of Ghanaians and average family size in the United States with a correlation coefficient (R) of -0.113 and weighted average of 3.29. Similarly, the statistical analysis conducted on geographies consisting of 137,456,280 people shows a poor negative correlation between the proportion of Immigrants from Singapore and average family size in the United States with a correlation coefficient (R) of -0.117 and weighted average of 3.16, a difference of 4.1%.
Average Family Size Correlation Summary
| Measurement | Ghanaian | Immigrants from Singapore |
| Minimum | 2.56 | 2.00 |
| Maximum | 3.96 | 3.61 |
| Range | 1.40 | 1.61 |
| Mean | 3.30 | 3.02 |
| Median | 3.32 | 3.09 |
| Interquartile 25% (IQ1) | 3.18 | 2.94 |
| Interquartile 75% (IQ3) | 3.44 | 3.20 |
| Interquartile Range (IQR) | 0.26 | 0.27 |
| Standard Deviation (Sample) | 0.26 | 0.32 |
| Standard Deviation (Population) | 0.26 | 0.32 |
Similar Demographics by Average Family Size
Demographics Similar to Ghanaians by Average Family Size
In terms of average family size, the demographic groups most similar to Ghanaians are Paiute (3.29, a difference of 0.020%), Immigrants from Ghana (3.29, a difference of 0.030%), Bolivian (3.29, a difference of 0.090%), Immigrants from Western Africa (3.29, a difference of 0.12%), and West Indian (3.29, a difference of 0.15%).
| Demographics | Rating | Rank | Average Family Size |
| Guamanians/Chamorros | 98.6 /100 | #100 | Exceptional 3.29 |
| Immigrants | Burma/Myanmar | 98.6 /100 | #101 | Exceptional 3.29 |
| West Indians | 98.5 /100 | #102 | Exceptional 3.29 |
| Immigrants | Western Africa | 98.4 /100 | #103 | Exceptional 3.29 |
| Bolivians | 98.3 /100 | #104 | Exceptional 3.29 |
| Immigrants | Ghana | 98.1 /100 | #105 | Exceptional 3.29 |
| Paiute | 98.0 /100 | #106 | Exceptional 3.29 |
| Ghanaians | 98.0 /100 | #107 | Exceptional 3.29 |
| Asians | 97.0 /100 | #108 | Exceptional 3.28 |
| Puerto Ricans | 96.7 /100 | #109 | Exceptional 3.28 |
| Bahamians | 96.6 /100 | #110 | Exceptional 3.28 |
| Indonesians | 96.2 /100 | #111 | Exceptional 3.28 |
| Blacks/African Americans | 95.7 /100 | #112 | Exceptional 3.27 |
| Immigrants | Panama | 95.6 /100 | #113 | Exceptional 3.27 |
| South Americans | 95.1 /100 | #114 | Exceptional 3.27 |
Demographics Similar to Immigrants from Singapore by Average Family Size
In terms of average family size, the demographic groups most similar to Immigrants from Singapore are Maltese (3.16, a difference of 0.010%), Tlingit-Haida (3.16, a difference of 0.030%), Iroquois (3.16, a difference of 0.050%), Immigrants from Germany (3.15, a difference of 0.050%), and Immigrants from Greece (3.16, a difference of 0.070%).
| Demographics | Rating | Rank | Average Family Size |
| Immigrants | Russia | 1.3 /100 | #262 | Tragic 3.16 |
| Immigrants | Bulgaria | 1.0 /100 | #263 | Tragic 3.16 |
| Americans | 1.0 /100 | #264 | Tragic 3.16 |
| Immigrants | South Africa | 0.9 /100 | #265 | Tragic 3.16 |
| Immigrants | Greece | 0.9 /100 | #266 | Tragic 3.16 |
| Iroquois | 0.8 /100 | #267 | Tragic 3.16 |
| Maltese | 0.8 /100 | #268 | Tragic 3.16 |
| Immigrants | Singapore | 0.7 /100 | #269 | Tragic 3.16 |
| Tlingit-Haida | 0.7 /100 | #270 | Tragic 3.16 |
| Immigrants | Germany | 0.7 /100 | #271 | Tragic 3.15 |
| Immigrants | Lithuania | 0.6 /100 | #272 | Tragic 3.15 |
| New Zealanders | 0.6 /100 | #273 | Tragic 3.15 |
| Immigrants | Belgium | 0.6 /100 | #274 | Tragic 3.15 |
| Cambodians | 0.6 /100 | #275 | Tragic 3.15 |
| Immigrants | Bosnia and Herzegovina | 0.5 /100 | #276 | Tragic 3.15 |