Central American Indian vs Immigrants from China Family Households
COMPARE
Central American Indian
Immigrants from China
Family Households
Family Households Comparison
Central American Indians
Immigrants from China
65.2%
FAMILY HOUSEHOLDS
98.3/ 100
METRIC RATING
99th/ 347
METRIC RANK
64.7%
FAMILY HOUSEHOLDS
86.6/ 100
METRIC RATING
136th/ 347
METRIC RANK
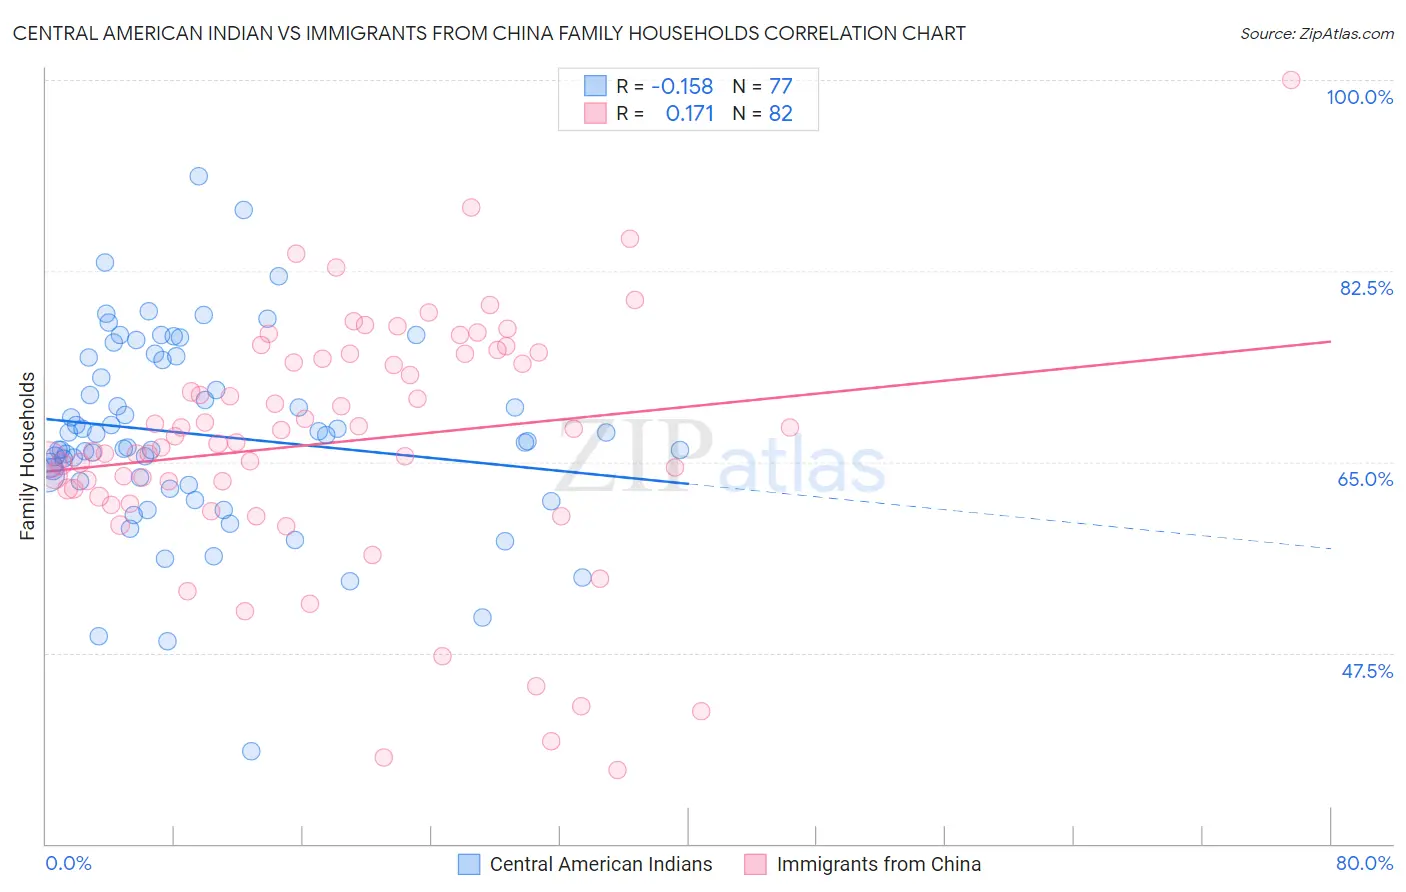
Central American Indian vs Immigrants from China Family Households Correlation Chart
The statistical analysis conducted on geographies consisting of 326,061,567 people shows a poor negative correlation between the proportion of Central American Indians and percentage of family households in the United States with a correlation coefficient (R) of -0.158 and weighted average of 65.2%. Similarly, the statistical analysis conducted on geographies consisting of 456,596,066 people shows a poor positive correlation between the proportion of Immigrants from China and percentage of family households in the United States with a correlation coefficient (R) of 0.171 and weighted average of 64.7%, a difference of 0.74%.
Family Households Correlation Summary
| Measurement | Central American Indian | Immigrants from China |
| Minimum | 38.5% | 36.8% |
| Maximum | 91.2% | 100.0% |
| Range | 52.8% | 63.2% |
| Mean | 67.5% | 66.8% |
| Median | 66.9% | 67.1% |
| Interquartile 25% (IQ1) | 63.1% | 62.5% |
| Interquartile 75% (IQ3) | 74.4% | 74.9% |
| Interquartile Range (IQR) | 11.3% | 12.4% |
| Standard Deviation (Sample) | 8.9% | 11.3% |
| Standard Deviation (Population) | 8.8% | 11.3% |
Similar Demographics by Family Households
Demographics Similar to Central American Indians by Family Households
In terms of family households, the demographic groups most similar to Central American Indians are Immigrants from Syria (65.2%, a difference of 0.020%), Haitian (65.2%, a difference of 0.040%), Chilean (65.2%, a difference of 0.040%), Swiss (65.2%, a difference of 0.060%), and Guatemalan (65.2%, a difference of 0.060%).
| Demographics | Rating | Rank | Family Households |
| Hopi | 98.8 /100 | #92 | Exceptional 65.3% |
| Guyanese | 98.8 /100 | #93 | Exceptional 65.3% |
| Immigrants | Poland | 98.7 /100 | #94 | Exceptional 65.2% |
| Immigrants | Portugal | 98.6 /100 | #95 | Exceptional 65.2% |
| Swiss | 98.6 /100 | #96 | Exceptional 65.2% |
| Guatemalans | 98.6 /100 | #97 | Exceptional 65.2% |
| Immigrants | Syria | 98.4 /100 | #98 | Exceptional 65.2% |
| Central American Indians | 98.3 /100 | #99 | Exceptional 65.2% |
| Haitians | 98.1 /100 | #100 | Exceptional 65.2% |
| Chileans | 98.1 /100 | #101 | Exceptional 65.2% |
| Immigrants | Sri Lanka | 98.0 /100 | #102 | Exceptional 65.1% |
| Indians (Asian) | 97.9 /100 | #103 | Exceptional 65.1% |
| Spaniards | 97.8 /100 | #104 | Exceptional 65.1% |
| English | 97.4 /100 | #105 | Exceptional 65.1% |
| Whites/Caucasians | 97.3 /100 | #106 | Exceptional 65.1% |
Demographics Similar to Immigrants from China by Family Households
In terms of family households, the demographic groups most similar to Immigrants from China are Immigrants from Scotland (64.7%, a difference of 0.010%), Maltese (64.7%, a difference of 0.030%), Basque (64.7%, a difference of 0.030%), Immigrants from Jamaica (64.7%, a difference of 0.030%), and Immigrants from North Macedonia (64.7%, a difference of 0.040%).
| Demographics | Rating | Rank | Family Households |
| Immigrants | Ecuador | 91.4 /100 | #129 | Exceptional 64.8% |
| Immigrants | Italy | 90.2 /100 | #130 | Exceptional 64.8% |
| Immigrants | Nonimmigrants | 90.1 /100 | #131 | Exceptional 64.8% |
| Cajuns | 89.4 /100 | #132 | Excellent 64.8% |
| Belizeans | 89.3 /100 | #133 | Excellent 64.8% |
| Greeks | 88.1 /100 | #134 | Excellent 64.7% |
| Maltese | 87.4 /100 | #135 | Excellent 64.7% |
| Immigrants | China | 86.6 /100 | #136 | Excellent 64.7% |
| Immigrants | Scotland | 86.4 /100 | #137 | Excellent 64.7% |
| Basques | 85.5 /100 | #138 | Excellent 64.7% |
| Immigrants | Jamaica | 85.3 /100 | #139 | Excellent 64.7% |
| Immigrants | North Macedonia | 84.9 /100 | #140 | Excellent 64.7% |
| Immigrants | Cameroon | 84.8 /100 | #141 | Excellent 64.7% |
| Pakistanis | 84.0 /100 | #142 | Excellent 64.7% |
| Czechoslovakians | 82.1 /100 | #143 | Excellent 64.6% |