Central American Indian vs Puget Sound Salish Births to Unmarried Women
COMPARE
Central American Indian
Puget Sound Salish
Births to Unmarried Women
Births to Unmarried Women Comparison
Central American Indians
Puget Sound Salish
39.0%
BIRTHS TO UNMARRIED WOMEN
0.0/ 100
METRIC RATING
306th/ 347
METRIC RANK
30.4%
BIRTHS TO UNMARRIED WOMEN
83.9/ 100
METRIC RATING
138th/ 347
METRIC RANK
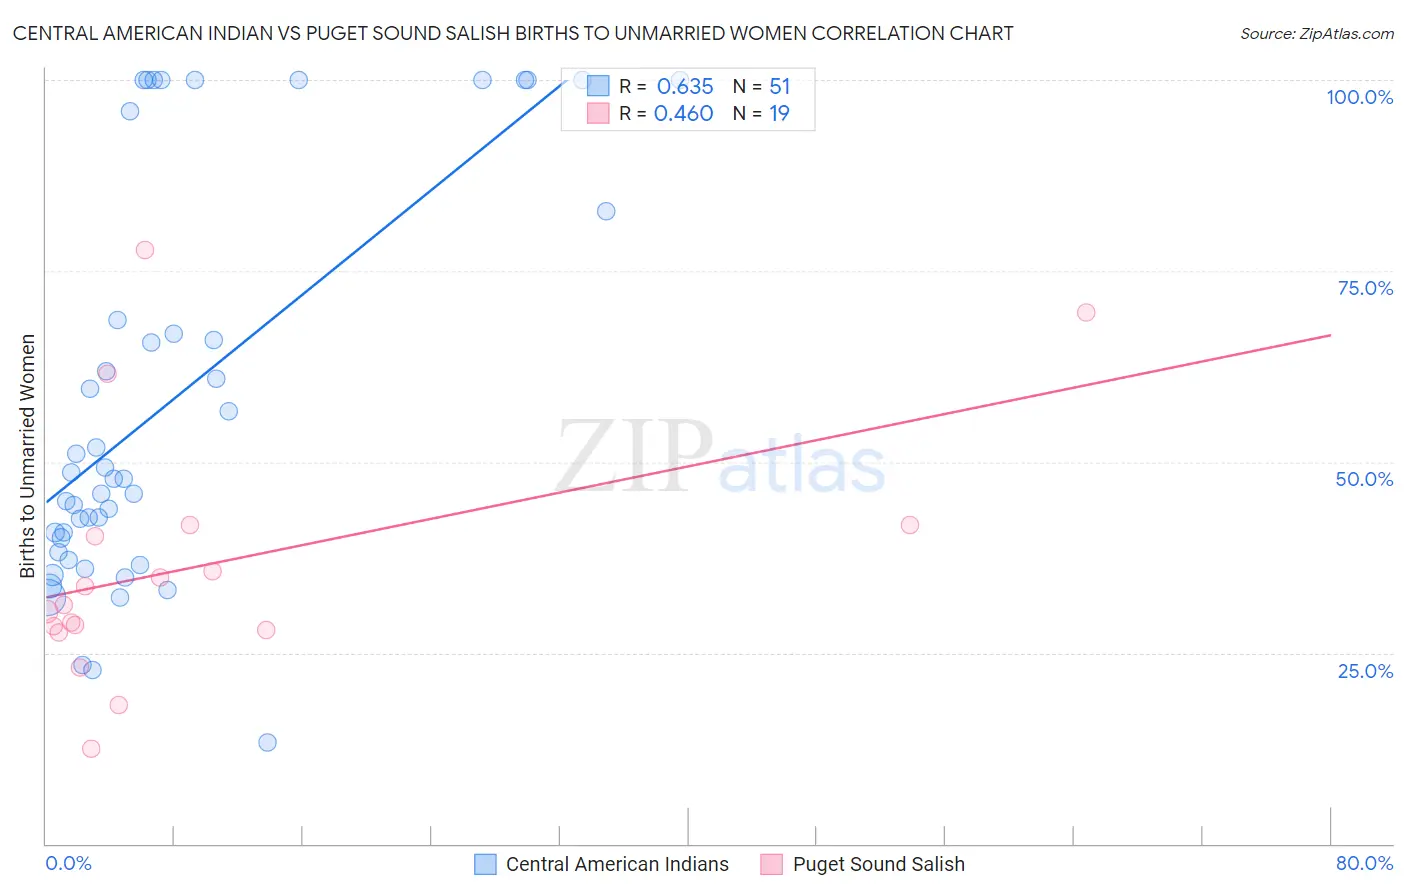
Central American Indian vs Puget Sound Salish Births to Unmarried Women Correlation Chart
The statistical analysis conducted on geographies consisting of 312,295,500 people shows a significant positive correlation between the proportion of Central American Indians and percentage of births to unmarried women in the United States with a correlation coefficient (R) of 0.635 and weighted average of 39.0%. Similarly, the statistical analysis conducted on geographies consisting of 44,862,304 people shows a moderate positive correlation between the proportion of Puget Sound Salish and percentage of births to unmarried women in the United States with a correlation coefficient (R) of 0.460 and weighted average of 30.4%, a difference of 28.0%.
Births to Unmarried Women Correlation Summary
| Measurement | Central American Indian | Puget Sound Salish |
| Minimum | 13.2% | 12.4% |
| Maximum | 100.0% | 77.8% |
| Range | 86.8% | 65.4% |
| Mean | 58.1% | 36.5% |
| Median | 47.9% | 31.3% |
| Interquartile 25% (IQ1) | 38.2% | 28.0% |
| Interquartile 75% (IQ3) | 82.8% | 41.7% |
| Interquartile Range (IQR) | 44.6% | 13.7% |
| Standard Deviation (Sample) | 26.3% | 16.7% |
| Standard Deviation (Population) | 26.0% | 16.2% |
Similar Demographics by Births to Unmarried Women
Demographics Similar to Central American Indians by Births to Unmarried Women
In terms of births to unmarried women, the demographic groups most similar to Central American Indians are Immigrants from Haiti (38.9%, a difference of 0.29%), Yaqui (38.8%, a difference of 0.39%), Immigrants from Jamaica (38.8%, a difference of 0.44%), Honduran (38.7%, a difference of 0.76%), and Immigrants from Honduras (39.3%, a difference of 0.86%).
| Demographics | Rating | Rank | Births to Unmarried Women |
| Spanish Americans | 0.0 /100 | #299 | Tragic 38.6% |
| Immigrants | West Indies | 0.0 /100 | #300 | Tragic 38.6% |
| Haitians | 0.0 /100 | #301 | Tragic 38.6% |
| Hondurans | 0.0 /100 | #302 | Tragic 38.7% |
| Immigrants | Jamaica | 0.0 /100 | #303 | Tragic 38.8% |
| Yaqui | 0.0 /100 | #304 | Tragic 38.8% |
| Immigrants | Haiti | 0.0 /100 | #305 | Tragic 38.9% |
| Central American Indians | 0.0 /100 | #306 | Tragic 39.0% |
| Immigrants | Honduras | 0.0 /100 | #307 | Tragic 39.3% |
| Aleuts | 0.0 /100 | #308 | Tragic 39.3% |
| Cubans | 0.0 /100 | #309 | Tragic 39.4% |
| Immigrants | Dominica | 0.0 /100 | #310 | Tragic 39.5% |
| Immigrants | Azores | 0.0 /100 | #311 | Tragic 39.6% |
| U.S. Virgin Islanders | 0.0 /100 | #312 | Tragic 39.6% |
| Africans | 0.0 /100 | #313 | Tragic 39.7% |
Demographics Similar to Puget Sound Salish by Births to Unmarried Women
In terms of births to unmarried women, the demographic groups most similar to Puget Sound Salish are Immigrants from Philippines (30.4%, a difference of 0.0%), Immigrants from Canada (30.4%, a difference of 0.030%), Immigrants from Scotland (30.4%, a difference of 0.13%), Swiss (30.5%, a difference of 0.14%), and Pakistani (30.5%, a difference of 0.16%).
| Demographics | Rating | Rank | Births to Unmarried Women |
| Immigrants | Zimbabwe | 85.7 /100 | #131 | Excellent 30.3% |
| New Zealanders | 85.5 /100 | #132 | Excellent 30.3% |
| Immigrants | Morocco | 85.2 /100 | #133 | Excellent 30.4% |
| Immigrants | South Eastern Asia | 85.2 /100 | #134 | Excellent 30.4% |
| Brazilians | 84.8 /100 | #135 | Excellent 30.4% |
| Immigrants | Scotland | 84.6 /100 | #136 | Excellent 30.4% |
| Immigrants | Philippines | 83.9 /100 | #137 | Excellent 30.4% |
| Puget Sound Salish | 83.9 /100 | #138 | Excellent 30.4% |
| Immigrants | Canada | 83.7 /100 | #139 | Excellent 30.4% |
| Swiss | 83.1 /100 | #140 | Excellent 30.5% |
| Pakistanis | 83.0 /100 | #141 | Excellent 30.5% |
| South Africans | 82.7 /100 | #142 | Excellent 30.5% |
| Immigrants | Uganda | 82.6 /100 | #143 | Excellent 30.5% |
| Czechs | 82.1 /100 | #144 | Excellent 30.5% |
| Immigrants | North America | 81.5 /100 | #145 | Excellent 30.6% |