Central American Indian vs Austrian Family Households
COMPARE
Central American Indian
Austrian
Family Households
Family Households Comparison
Central American Indians
Austrians
65.2%
FAMILY HOUSEHOLDS
98.3/ 100
METRIC RATING
99th/ 347
METRIC RANK
64.5%
FAMILY HOUSEHOLDS
68.5/ 100
METRIC RATING
154th/ 347
METRIC RANK
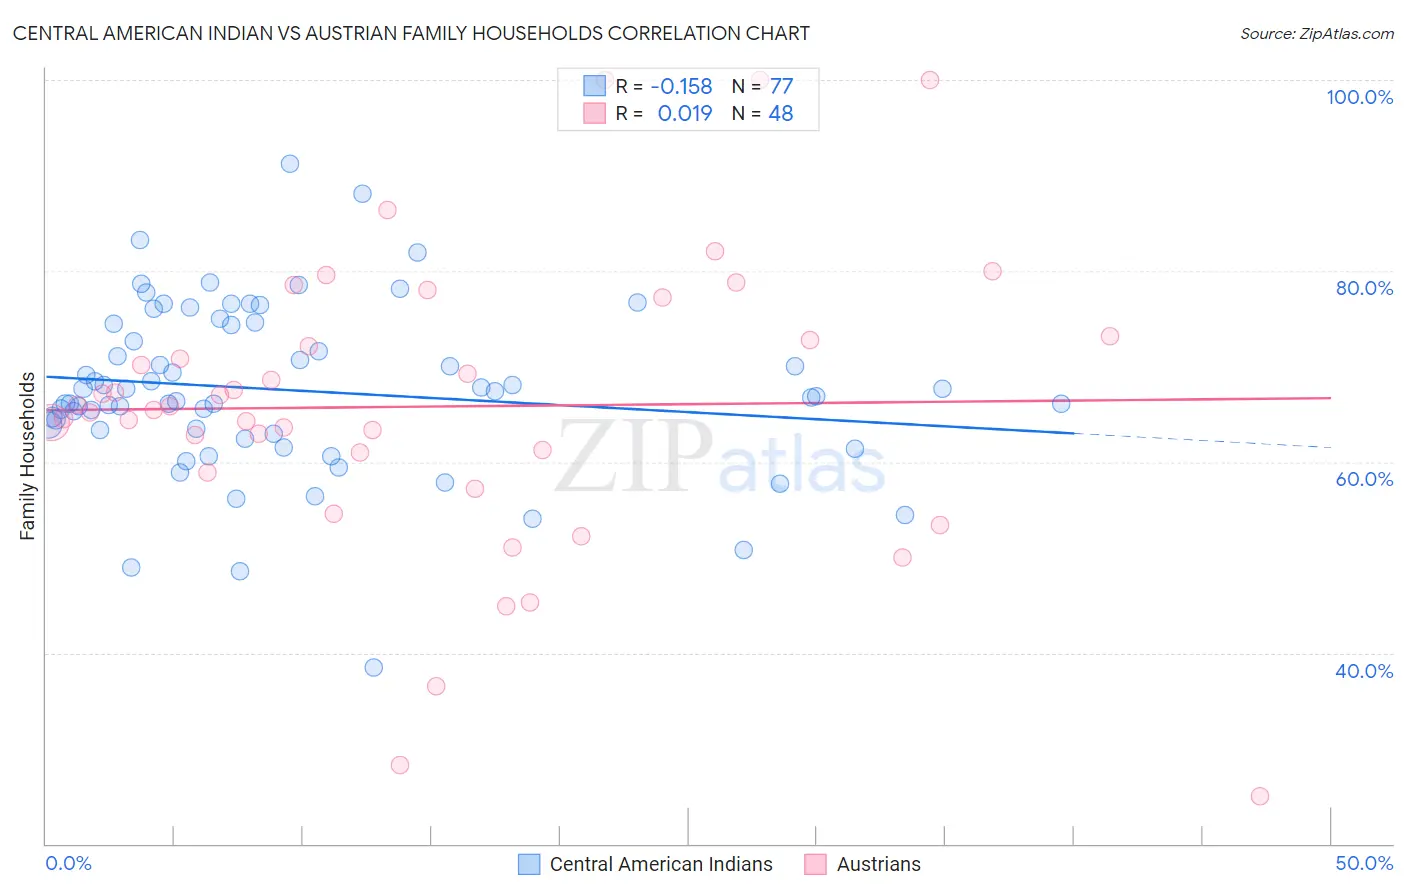
Central American Indian vs Austrian Family Households Correlation Chart
The statistical analysis conducted on geographies consisting of 326,061,567 people shows a poor negative correlation between the proportion of Central American Indians and percentage of family households in the United States with a correlation coefficient (R) of -0.158 and weighted average of 65.2%. Similarly, the statistical analysis conducted on geographies consisting of 451,810,725 people shows no correlation between the proportion of Austrians and percentage of family households in the United States with a correlation coefficient (R) of 0.019 and weighted average of 64.5%, a difference of 1.1%.
Family Households Correlation Summary
| Measurement | Central American Indian | Austrian |
| Minimum | 38.5% | 25.0% |
| Maximum | 91.2% | 100.0% |
| Range | 52.8% | 75.0% |
| Mean | 67.5% | 65.8% |
| Median | 66.9% | 65.7% |
| Interquartile 25% (IQ1) | 63.1% | 60.0% |
| Interquartile 75% (IQ3) | 74.4% | 72.9% |
| Interquartile Range (IQR) | 11.3% | 13.0% |
| Standard Deviation (Sample) | 8.9% | 15.5% |
| Standard Deviation (Population) | 8.8% | 15.4% |
Similar Demographics by Family Households
Demographics Similar to Central American Indians by Family Households
In terms of family households, the demographic groups most similar to Central American Indians are Immigrants from Syria (65.2%, a difference of 0.020%), Haitian (65.2%, a difference of 0.040%), Chilean (65.2%, a difference of 0.040%), Swiss (65.2%, a difference of 0.060%), and Guatemalan (65.2%, a difference of 0.060%).
| Demographics | Rating | Rank | Family Households |
| Hopi | 98.8 /100 | #92 | Exceptional 65.3% |
| Guyanese | 98.8 /100 | #93 | Exceptional 65.3% |
| Immigrants | Poland | 98.7 /100 | #94 | Exceptional 65.2% |
| Immigrants | Portugal | 98.6 /100 | #95 | Exceptional 65.2% |
| Swiss | 98.6 /100 | #96 | Exceptional 65.2% |
| Guatemalans | 98.6 /100 | #97 | Exceptional 65.2% |
| Immigrants | Syria | 98.4 /100 | #98 | Exceptional 65.2% |
| Central American Indians | 98.3 /100 | #99 | Exceptional 65.2% |
| Haitians | 98.1 /100 | #100 | Exceptional 65.2% |
| Chileans | 98.1 /100 | #101 | Exceptional 65.2% |
| Immigrants | Sri Lanka | 98.0 /100 | #102 | Exceptional 65.1% |
| Indians (Asian) | 97.9 /100 | #103 | Exceptional 65.1% |
| Spaniards | 97.8 /100 | #104 | Exceptional 65.1% |
| English | 97.4 /100 | #105 | Exceptional 65.1% |
| Whites/Caucasians | 97.3 /100 | #106 | Exceptional 65.1% |
Demographics Similar to Austrians by Family Households
In terms of family households, the demographic groups most similar to Austrians are Uruguayan (64.5%, a difference of 0.010%), Swedish (64.5%, a difference of 0.020%), Czech (64.5%, a difference of 0.020%), Canadian (64.4%, a difference of 0.030%), and Lebanese (64.4%, a difference of 0.030%).
| Demographics | Rating | Rank | Family Households |
| Immigrants | Chile | 76.5 /100 | #147 | Good 64.6% |
| Delaware | 76.3 /100 | #148 | Good 64.6% |
| Sioux | 76.3 /100 | #149 | Good 64.6% |
| Romanians | 75.3 /100 | #150 | Good 64.5% |
| Syrians | 75.2 /100 | #151 | Good 64.5% |
| Scottish | 70.9 /100 | #152 | Good 64.5% |
| Swedes | 69.8 /100 | #153 | Good 64.5% |
| Austrians | 68.5 /100 | #154 | Good 64.5% |
| Uruguayans | 67.7 /100 | #155 | Good 64.5% |
| Czechs | 67.0 /100 | #156 | Good 64.5% |
| Canadians | 66.6 /100 | #157 | Good 64.4% |
| Lebanese | 66.4 /100 | #158 | Good 64.4% |
| Germans | 65.8 /100 | #159 | Good 64.4% |
| Immigrants | Moldova | 65.2 /100 | #160 | Good 64.4% |
| Immigrants | England | 62.6 /100 | #161 | Good 64.4% |