Central American Indian vs Puget Sound Salish Ambulatory Disability
COMPARE
Central American Indian
Puget Sound Salish
Ambulatory Disability
Ambulatory Disability Comparison
Central American Indians
Puget Sound Salish
7.2%
AMBULATORY DISABILITY
0.0/ 100
METRIC RATING
317th/ 347
METRIC RANK
6.9%
AMBULATORY DISABILITY
0.0/ 100
METRIC RATING
299th/ 347
METRIC RANK
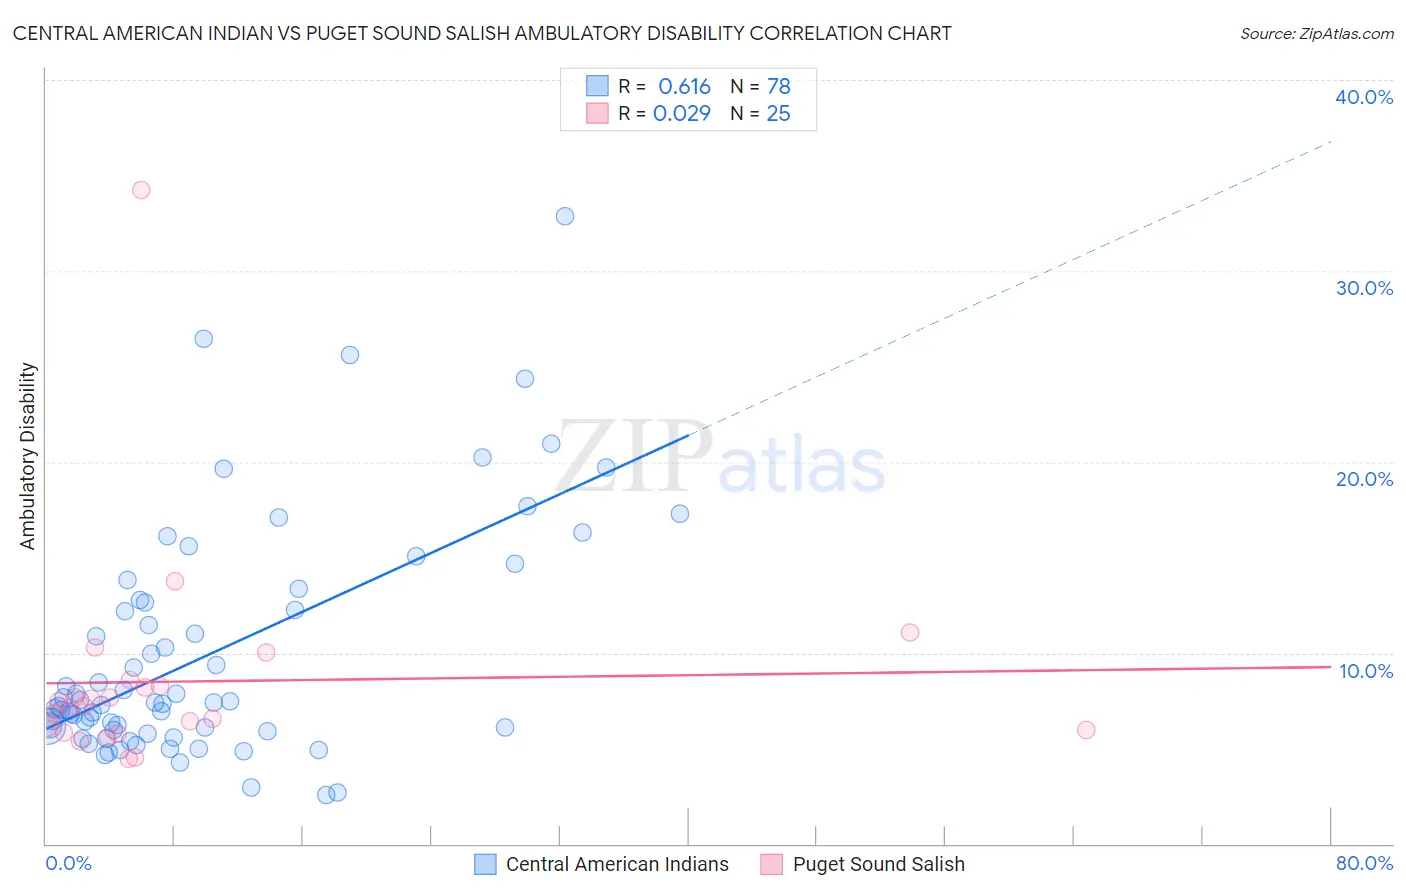
Central American Indian vs Puget Sound Salish Ambulatory Disability Correlation Chart
The statistical analysis conducted on geographies consisting of 326,071,152 people shows a significant positive correlation between the proportion of Central American Indians and percentage of population with ambulatory disability in the United States with a correlation coefficient (R) of 0.616 and weighted average of 7.2%. Similarly, the statistical analysis conducted on geographies consisting of 46,152,398 people shows no correlation between the proportion of Puget Sound Salish and percentage of population with ambulatory disability in the United States with a correlation coefficient (R) of 0.029 and weighted average of 6.9%, a difference of 3.0%.
Ambulatory Disability Correlation Summary
| Measurement | Central American Indian | Puget Sound Salish |
| Minimum | 2.6% | 4.5% |
| Maximum | 32.9% | 34.2% |
| Range | 30.3% | 29.7% |
| Mean | 9.9% | 8.5% |
| Median | 7.4% | 7.2% |
| Interquartile 25% (IQ1) | 6.0% | 5.9% |
| Interquartile 75% (IQ3) | 12.6% | 8.4% |
| Interquartile Range (IQR) | 6.7% | 2.5% |
| Standard Deviation (Sample) | 6.1% | 5.8% |
| Standard Deviation (Population) | 6.0% | 5.6% |
Demographics Similar to Central American Indians and Puget Sound Salish by Ambulatory Disability
In terms of ambulatory disability, the demographic groups most similar to Central American Indians are Immigrants from Dominican Republic (7.1%, a difference of 0.080%), Ottawa (7.2%, a difference of 0.090%), Shoshone (7.1%, a difference of 0.32%), Blackfeet (7.1%, a difference of 0.34%), and Immigrants from Yemen (7.1%, a difference of 0.36%). Similarly, the demographic groups most similar to Puget Sound Salish are Marshallese (6.9%, a difference of 0.010%), Immigrants from Grenada (6.9%, a difference of 0.13%), British West Indian (7.0%, a difference of 0.24%), Immigrants from Armenia (7.0%, a difference of 0.30%), and African (7.0%, a difference of 0.35%).
| Demographics | Rating | Rank | Ambulatory Disability |
| Immigrants | Grenada | 0.0 /100 | #298 | Tragic 6.9% |
| Puget Sound Salish | 0.0 /100 | #299 | Tragic 6.9% |
| Marshallese | 0.0 /100 | #300 | Tragic 6.9% |
| British West Indians | 0.0 /100 | #301 | Tragic 7.0% |
| Immigrants | Armenia | 0.0 /100 | #302 | Tragic 7.0% |
| Africans | 0.0 /100 | #303 | Tragic 7.0% |
| Immigrants | Cabo Verde | 0.0 /100 | #304 | Tragic 7.0% |
| Immigrants | Micronesia | 0.0 /100 | #305 | Tragic 7.0% |
| Iroquois | 0.0 /100 | #306 | Tragic 7.1% |
| Spanish Americans | 0.0 /100 | #307 | Tragic 7.1% |
| Chippewa | 0.0 /100 | #308 | Tragic 7.1% |
| Immigrants | Azores | 0.0 /100 | #309 | Tragic 7.1% |
| Arapaho | 0.0 /100 | #310 | Tragic 7.1% |
| Cree | 0.0 /100 | #311 | Tragic 7.1% |
| Delaware | 0.0 /100 | #312 | Tragic 7.1% |
| Immigrants | Yemen | 0.0 /100 | #313 | Tragic 7.1% |
| Blackfeet | 0.0 /100 | #314 | Tragic 7.1% |
| Shoshone | 0.0 /100 | #315 | Tragic 7.1% |
| Immigrants | Dominican Republic | 0.0 /100 | #316 | Tragic 7.1% |
| Central American Indians | 0.0 /100 | #317 | Tragic 7.2% |
| Ottawa | 0.0 /100 | #318 | Tragic 7.2% |